Announcement of Smap Release August 2013

This release includes:

  1. The name of the logged on user will now be shown in the top right of the template management screen. If you click on this name you can change your details and your password.  You can also logout of the server.
  2. A change in the appearance of the “upload template” section of template management.  The big button now downloads the spreadsheet instead of opening odkBuild.  The link to odkBuild has been moved further down the screen.
  3. Performance improvements when multiple users are updating the dashboard using the same user name.
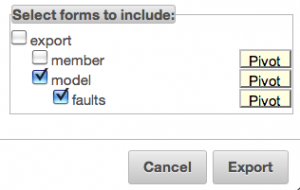
  4. When exporting surveys to a spreadsheet, you can now select which repeating groups to export and flatten individual repeating groups so that their data appears in a single row.  More on this here.  You can also specify that the GPS coordinates of a point be split into two columns for latitude and longitude.  This may assist when importing the survey into some GIS tools.

vehicle_faults

Assign a task and export the results to Openstreetmap

This article demonstrates how to assign a task that will tell a user what data to collect and where to collect it.  The data will replace previously collected data and will then be loaded into Openstreetmap. An ODK compatible tool called fieldTask will be used.

Step 1. Create one or more tasks for someone to go and update the previously collected data.  This is done with the “Create Task” function in Smap. In this case I selected the previous address survey as the starting point and checked “Update existing results” which means that the old results will be replaced by the new. After creating the tasks they show up as red lines on the map on the “Assign” page. Red meaning “not yet allocated to anyone”.

assign task

Step 2. Assign the task. I assigned the longer survey containing odd addresses to myself.

Step 3. Download the task to the phone. On my phone I selected Menu then “Refresh Task List” which downloads the task and displays it in the task list and task map.

Step 4. Collect the new data. When I got to the location shown on the map I opened the survey and proceeded to record the missing addresses.

complete odk type survey in fieldTask

Step 5. Upload the results. After submitting the results, the dashboard shows that there are still two “good” records of address data, record 1 having been replaced by record 3.

Survey Analysis - Existing Record Replaced by new Record

I then exported the results in OSM format. This time I did not select any “ways” to be generated as I just wanted the address points. In JOSM I deleted the old address points that include an interpolation way, slightly adjusted the locations using Bing imagery and uploaded to the server. Click here to view the new addresses in Openstreetmap.

This technique could be useful during a response to a rapid onset emergency although it is unlikely that odk type surveys would be used to collect data that is loaded unchanged into Openstreetmap as it was here.  Instead there might be a need to take a subset of a complex survey and load only the tags relevant to OSM.  This would either be quite intensive manual work in JOSM or a filtering and transformation function could be added to the OSM export.

Testing a long survey

When creating long surveys for fieldTask you may want to try out a newly created, or modified section, that is a long way from the start. Its time consuming having to swipe past a lot of early questions and even worse if these have been set as “required”.  To quickly get to the right section you can use the “Go To Prompt” feature. Figure 1.

Start the survey in fieldTask or, odkCollect, select “menu” then “Go To Prompt”. A list of questions will be displayed which you can scroll through to find the question you want.

If you have repeating groups in your survey then this list of questions will initially stop at the repeat group.  To go further press on the downward arrow at the left of the repeat group name. Figure 2.


end2

Figure 3

Then press on the name that will appear at the bottom of the screen. The questions in the repeating group will be shown and you can continue to scroll down to find the section that you want to test.

Announcement of Smap Release – July 2013

Yep we missed a release in June this release contains 2 months of changes. New Features:

  1. Exporting of surveys to Openstreetmaps.  Refer to http://blog.zarkman.eu/?p=310 for details.
  2. Block submission of new results.  On the template management screen you can block or unblock a survey by clicking the checkbox next to the survey name.  This could be used where you have completed a survey and are analysing the results, however additional results are being submitted by someone who is demonstrating or testing the survey tool.
  3. Reports can be accessed by external systems through a reporting API. Download from here.
  4.  Reports can be embedded in WordPress blogs (or any other container that support the oEmbed standard).
  5. The bounding box of the area covered by a report is now shown rather than just showing a point for the report.
  6. Maps can be included in reports.
  7. The text that describes a graph or map has been improved. The text for a map now describes all the layers on the map.
  8. Validation on loading of templates.  The converted database friendly question names are now checked for duplicates.  Hence if you had a question named hdm0.1 and another hdm0x1. Then these would be reported as duplicates and the template would not be loaded. The reason that they are duplicates is that characters that are not accepted by the database as column names are converted into “x”.
  9. The XLS file that was submitted as a survey template can be downloaded from the template management page.
  10. Survey templates can be downloaded as a PDF.  This feature uses the Links Codebook code from Nafundi which has been modified to be accessible via a web service rather than on the desktop.
  11. Assignments of tasks are shown in a table as well as on the map.

The July version of the Smap server can be downloaded from here.


Exporting Surveys to Openstreetmap

I have added a new option to the Smap Server that will export a survey in OSM format. The following video shows this being used to add house numbers to Openstreetmap.

The survey from that video is defined in an XLSForm template reproduced below:
osmsurvey

This survey will collect the street name, odd or even, country, city, postcode in the top level form. It then collects the house numbers and their locations in a repeating group.  Some of the top level fields are copied into each house record using the “calculate” type.

I have adopted a couple of naming conventions for surveys that are destined to be exported to osm.

  1. Any question name that starts with an underscore, such as _country, is not exported.
  2. If the question name starts with “addr_”, then that is changed to “addr:”. The reason for this is that XLSForm did not seem to support the use of colons inside names but they are used in OSM key values.

I completed the survey twice to get the house numbers for a street called Jewell Crescent. When the results are exported the OSM file looks like this:

[code language=”xml”]


[/code]

After loading into Openstreetmap it looks like this.

This new functionality is in the source code now. It will be included in the next production release of Smap on Sunday 28th of July, after which the server can be downloaded from here.
Other Thoughts

  1. Currently option names map to OSM values.  This is quite restrictive as ODK does not allow these names to have spaces.  I will probably add an option to the export function that, if set, will use the option label to set the OSM value.
  2. You can export any survey to Openstreetmap.  Most of the time these won’t have been designed to be loaded directly as the demo was.  However it can still be useful to get the data into JOSM and then manually copy information into new OSM nodes.  For example if you have a survey with information on health clinics.

Connected Arabic fonts in Android 2.3

I’m working with a customer that is conducting a survey in Iraq using Samsung Galaxy Y Duos (android 2.3) and fieldTask. Later model phones (android 3+) worked well with Arabic but not these earlier versions. Even after rooting the phones and installing new fonts it still didn’t connect the characters.  See below a screen shot using Dr Ben Ox Arabic fonts which seemed to give the best results.
arabic2 (1)

Fortunately there is an Arabic reshaping library available from https://github.com/agawish/Better-Arabic-Reshaper/ which can be used with these old phones. I added ArabicReshaper.java and ArabicUtilities.java from this library to the odkCollect library that performs survey completion in fieldTask. I then modified the “QuestionWidget.java”, “SelectOneWidget.java” and “SelectMultipleWidget.java” files in odkCollect to call the “reshape” function when setting the text. See line 12 below.

[code language=”java” highlight=”11,12″]
protected void addQuestionText(FormEntryPrompt p) {
String imageURI = p.getImageText();
String audioURI = p.getAudioText();
String videoURI = p.getSpecialFormQuestionText(“video”);

// shown when image is clicked
String bigImageURI = p.getSpecialFormQuestionText(“big-image”);

// Add the text view. Textview always exists, regardless of whether there’s text.
mQuestionText = new TextView(getContext());
// mQuestionText.setText(p.getLongText()); smap
mQuestionText.setText(ArabicUtilities.reshape(p.getLongText())); // smap
mQuestionText.setTextSize(TypedValue.COMPLEX_UNIT_DIP, mQuestionFontsize);
mQuestionText.setTypeface(null, Typeface.BOLD);
mQuestionText.setPadding(0, 0, 0, 7);
mQuestionText.setId(QuestionWidget.newUniqueId()); // assign random id

// Wrap to the size of the parent view
mQuestionText.setHorizontallyScrolling(false);

if (p.getLongText() == null) {
mQuestionText.setVisibility(GONE);
}

// Create the layout for audio, image, text
mediaLayout = new MediaLayout(getContext());
mediaLayout.setAVT(p.getIndex(), “”, mQuestionText, audioURI, imageURI, videoURI, bigImageURI);

addView(mediaLayout, mLayout);
}
[/code]

This improved the display significantly:
SC20130708-172712

This Arabic version of fieldTask is available for download from http://dev/smap.com.au. There are other widgets that could have this functionality added and presumably the arabic text typed by an enumerator in a text field should also be reshaped. These additional changes will be made on an as needs basis. The preferred option is to get a phone that supports Arabic fonts natively which would be a better option than having to root the phones to install new fonts.

Map with locations shown by OCHA icons

This is another test of embedding a Smap report into WordPress. Here is the report now.

https://dev.smap.com.au/surveyKPI/reports/view/55b17e69-e303-4993-94af-679ac21187e7

The major change since the last test report is more space for the meta information and the creation of automatic commentary on the report.  For example the lines:

  1. Shows the location of responses to the question ‘Select type’ in survey ‘ocha’ grouped by the responses to the question Record location
  2. Shows the percentage of responses that selected each option in the question ‘Problems’ in survey ‘speed’ grouped by the responses to the question Set Location

These were automatically generated to describe the two layers of data on the map.  I think they could be clearer though.  The final line “Comment provided by DME manager” was typed in when the report was created in Smap and before it was published to WordPress.

Embedding into WordPress is a great way to publish reports as you can add supporting material.  For example here is a tweet.

Anyway for more information contact me at Smap Consulting.  neilpenman@gmail.com


Smap Reports API version 1.0 Released

The API can be used to retrieve report data from a Smap server.  This version is out of draft however it will evolve with feedback from the Speed Evidence project team and the Ushahidi developers who are creating a Portal that will consume the API.  Hopefully it should be fully implemented in Smap releases from the 1st of August.

Download from here.

The API will allow the proposed Speed Evidence Portal to present survey data alongside relevant community information submitted using SMS messages.

Statistical Analysis of Public Tweets to Provide Early Notification of Emergency Events

CSIRO have been developing software for monitoring social media.  Last monday I went to Canberra to talk to Ron Jones who is responsible for business development of these products.  We met, near his office on the ANU campus, at the Purple Pickle cafe.

We discussed two products but I am going to focus on the Emergency Situation Awareness application (ESA) for this blog post since its very relevant to the work that Smap Consulting does. The title of this post is a quote from a video produced by CSIRO showing how ESA works.

My understanding is that ESA analyses the frequency of occurrence of key words or hashtags in tweets over a period of several months. Then if there is a deviation from the background level of a word during a 2 minute window an alert will be created at one of 4 levels depending on the amount of deviation; green-blue-purple-red.  Here is a screen shot from the video showing alerts for the word storm around about the time a tropical storm hit Brisbane.

alerts


The second column is the date and time that the alerts began, the third column the duration that an elevated alert level was maintained and the 4th column the number of alerts during that period. ESA has an API that allows an external system to interrogate the statistical server.

This would be a great tool to integrate with Smap and Ushahidi to get a better picture of the situation after a rapid onset emergency.  ESA could be used to identify new events while Smap can be used to provide an assessment of that event.  The results can then be shown on a tool such as the Speed portal, further filtering the “firehose” of information that emergency workers can be subjected to.

Getting this tool applied to rapid onset emergencies in developing countries would require a little bit of effort and cash. For example currently only tweets in Australia are monitored.  Possibly we would need a server for Africa or Asia etc. However it looks very promising to me.