
The main change in this release is that managed forms have been improved and are now ready for production use. Documentation is available here. The Beta status has also been removed from the online editor.
Other Changes
Automatic “erase” of forms
A notice has been added to the home page stating that deleted forms will be automatically erased from the system after 3 months. Deleting a form only makes it invisible. You can restore it along with all of its data if you realise that you still need the data. To permanently erase a survey you have to manually erase it. However it seems that a lot of people are forgetting to do this which is a security issue as well as making the database larger than it needs to be. Hence the automatic erase 3 months after deletion. If you are deleting a survey which contains sensitive information you may still want to manually erase it straight away. This new policy will take effect from the end of November 2016.
Include Maps in PDF Exports
When generating a PDF location, the answer to location questions are now shown on a map.
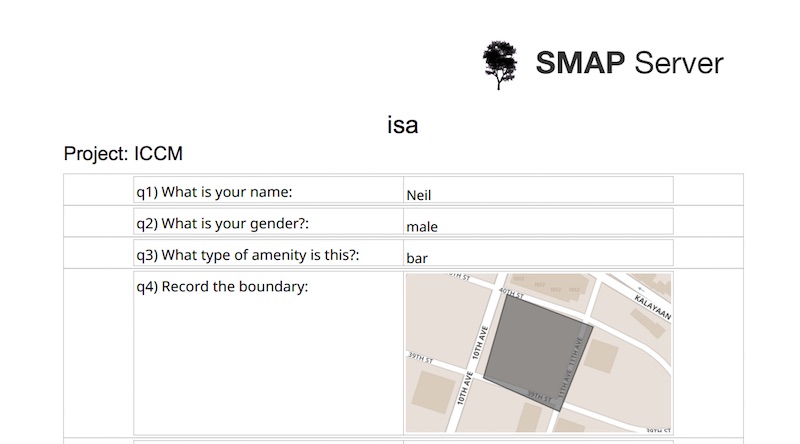
When location data is available then the map dimensions are generated automatically. If you are downloading a blank template then you will need to specify the map dimension in the appearance column of the form definition. The appearance options are:
pdflocation_xxxx, where xxxx should be replaced by the longitude, latitude and zoom. For example: pdflocation_121,14.6,16
pdfmap_xxxx, where xxxx should be replaced by the mapbox map to use. The default is mapbox.streets
Filter by date when exporting results
Start and end dates can be selected when exporting results just as they can be for viewing results on the dashboard.
Filter results by the date they were uploaded to the server
In analysis you can now filter by the date the survey results were uploaded as well as start of survey, end of survey and date questions. This is available when showing a graph, map or table on the dashboard. It has also been added to the new feature for exporting results.
HXL tags
HXL is the Humanitarian Exchange Language . It consists of number of tags that you can add to the second row of a spreadsheet of data that will help interpretation of that data when it is loaded into HDX. Tags look like Twitter hashtags, for example #sector to identify the column as containing the name of the cluster.
To specify the HXL for a column of data add the tag in the question’s appearance. For choices in a select multiple the attribute “+label” is automatically added to the attribute.
The row of HXL tags will then be added to excel exports if you select the HXL option in the export dialog.

The major limitation of this current implementation is that the export data is raw data whereas HXL and HDX are mainly used with aggregated data. The next release of Smap will include the use of HXL in aggregate reports.