Journal Reference – Crime and Safety in Selected Papua New Guinea Provinces
April 2026
Smap was mentioned in the paper https://openresearch-repository.anu.edu.au/entities/publication/a591b312-f0e4-4704-999f-f50f1baecadc, authored by ANU in collaboration with the University of Papua New Guinea.
Digitalisation of Bougainville Police
April 2023
The radio news bulletin below was broadcast by NBC Bougainville on the 20th of April. It describes an Electronic Occurrence Book created by the Bougainville Police Service using Smap. The BPS news item is the second one in the broadcast and starts at 4:07 up to 7:12.
Additional references to this project are available at the following sites:
- A partial transcript and some pictures are available on the broadcaster’s Facebook page.
- The Australian High Comission in Papua New Guinea has now also put out an announcement about this project.
- The project has been mentioned in 2 LinkedIn posts by the CTO of the PNG Department of Information and Communication Technology:
NVS Online Recruitments
July 2021
Here is a link to a you tube video containing a report from TV One on the NVS online recruitment application. This was built by Omie Consulting using Smap. https://www.youtube.com/watch?v=EDpORcWijZc
Development of cave surveying application and GIS database – Felix Ugarte Caving Team
March 2021
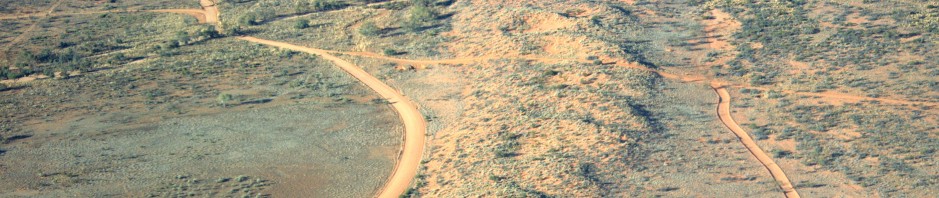
The Felix Ugarte Caving Team is a caving team focused on caving and archeology research in the county of Gipuzkoa in Basque Country. In our daily work we do many different jobs like searching for new caves, exploring them and surveying them , archeological prospecting, hydrogeology researches.
The base of our activities are caves and so we need a good and easy to use system to add the newly located caves to our database, update wrong coordinates and manage all the information we generate related to caves and different hydrogeological systems.
During many years this information was kept in maps or documents with coordinates, then changed to excel sheets and then some years on we developed a web application to organize it. But recently we realized we needed a better way to organize our data and give some Geographical Information System (GIS) capabilities to our database.
Thanks to the coronavirus confinement we developed a web application connected to a PostGIS database so we could add locations of the new caves while prospecting in the mountain. But even this application should work offline, we had some technical difficulties and was not working as expected.
Even though this didn’t stop us and we kept looking for new ways to improve our infrastructures. Finally we found Neil Penman and his Smap web application that was fitting like a glove to our needs. We could complete surveys while being offline in the mountain and upload the information to the database when online, connect to the database from QGIS to make complex data analysis and get some information of our locations automatically thanks to the PostGIS database.
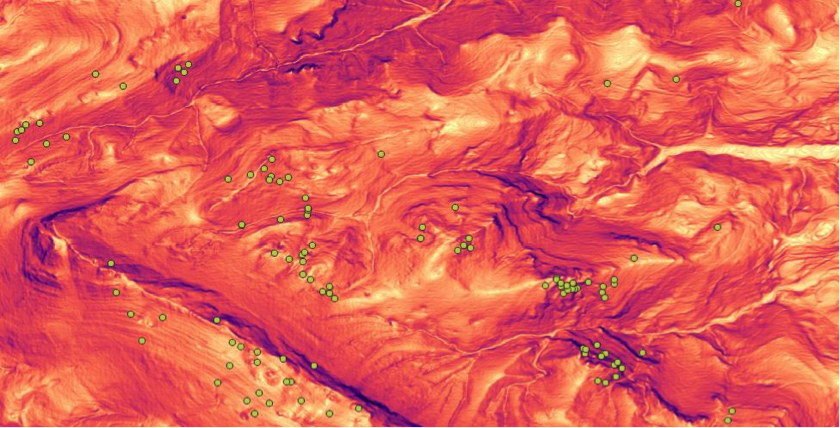
Now we are developing the back-end database, so that every time we complete a survey and add or update the location of a wrong cave, PostGIS database will find the altitude from a 1m resolution Digital Elevation Model (DEM) (with this we solve the problem of vertical accuracy on GPS because some devices get the altitude over the ellipsoid and other over the spheroid). We also added a slope and an orientation raster so we can get more information about the location of the cave. From an archeological point of view orientation is important because most caves keeping ancient buried people are south facing.
The information we collect with Smap and FieldTask is shared with another web applications we have generating a GeoJSON file, so we can integrate both applications easily.
If our programming knowledge increases, in the future we could even upload cave surveys to the PostGIS database and then export them automatically to a shapefile to represent them in maps or even show 3D models of the caves in our online catalog (not sure if this will be technically possible).
But for now we conform giving some basic GIS capabilities to our database developing functions to make queries like finding the nearest rivers of a cave, exporting caves to GPX, SHP or CSV just selecting an area in the map or finding the best route to get to a cave. This will be useful to share information with other caving teams and emergency or archeology departments of the government.
We would like to thank Neil for developing this awesome application and for the support he gave us during deployment.
Jon
Agriculture – Cphatow
June 2020
We use Smap in 3 main flows of our Agri Supply Chain System
- Supply chain sector where forms are used to collect data for a) product/crop purchasing b) product/crop movement. c) product/crop reception. and d) product/crop bagging for stocking
- Farmer & farmer sector [this is more for farmer livelihood], smap forms are used for; a) Farmer registration b) Farmer auditing c) Farmer trainings & meetings
- Organisation mapping sector [more on farmer locality/location & geographical mapping] – collects GPS data for each key player in the agr-flow attached to a particular client
Enoch Kirabo
Education – MEQA
November 2018
My team and I had been working with other organizations in our attempt to put together an eMonitoring system that worked perfectly for our organization’s education programmes in 3 national offices (Cambodia, Nepal and Bangladesh). With the scale of the work in our World Vision National Offices, we needed to not only develop digital observation tools, but also program instant feedback functionalities on the app itself. This would enable the monitors to provide and prioritize the coaching points to facilitators and teachers in a way that transformed a monitoring visit to one of mentorship, rather than simply data extraction.
It was not until we started working with SMAP, specifically with Neil Penman, that all our eMonitoring wishes came to life. What took us months to discuss and deliver with others, took Neil a week. He setup our ODK forms and provided extra features based on the specific needs of our educational programme. Even after setting things up, he is also supportive of how we take ownership of the administration.
Above all things, it is this support that I appreciate the most from Neil — the instant support and assurance that he would know the answer (or that if he didn’t know the answer, he would get back to you within a couple of hours). An additional factor is that we had linked SMAP to PowerBi in order to provide semi-real time visualization of the data analysis. Even in this step, Neil also helped us in figuring out how the connections worked when we came across kinks. Our eMonitoring system, MEQA as we call it, is now in such a state that we feel confident to roll-out the system to other National Offices as well.
Alodia Santos
Technical Advisor – Education,
World Vision International
Journal Reference
August 2018
FieldTask was mentioned in the following paper Factors Affecting Rehabilitation of Food Security: A Study in Earthquake – Affected Districts in Nepal by Dhruba Raj Ghimire.
HERD
November 2016
I ran a two day advanced data collection training course at HERD, Kathmandu. They subsequently wrote a blog post about the course.
Calgary Water Board
Calgary suffered its worst flood in almost 100 years in 2013, putting most of our downtown underwater.
In this disaster, the majority of the inner city had no power, and all our municipal networks were down for many days. None of our existing technology (mobile, or desktop) was connected, or functioning. After many days, we eventually gained partial network functionality, but still none of our inspection or mapping software worked.
Shortly afterwards, we began using Smap to inspect critical flood-related infrastructure as a best-practice. Smap was chosen because it is cross-compatible with any device, and 100% functional offline, while still offering all the connectivity features of other, far more expensive networked inspection software.
In the event of another natural disaster, this system allows us to continue to operate and collect high-quality critical inspection data regardless of network update or connectivity.
In addition, we found it vastly simpler to train our staff with this tool. It could literally be deployed in minutes, while more extensive training was often required to understand other proprietary tools.

We continue to use Smap today, and Neil has continued to kindly help us with it as needed. I implemented this inspection system for my group at the time. I no longer work in the area but they continue to use the software despite regular sales pitches from proprietary vendors. None of them have been able to offer the same level of features, reliability, cost-effectiveness, and cross-compatability. Our corporation does not use the software for its price. We chose it, and continue to use it, for the functionality.
It is simply put, a best-of-breed tool from a practicality standpoint, and absolutely the most cost-effective.

The best part about it, however, is working with Neil, and his community-driven, agile framework for software development that has allowed Smap to evolve in ways that have been highly relevant to our needs.
Solomon Islands Health Facility Costing Study – 2015
August 2015
The data collection for this study took place in early 2014 using a Smap server and mobile phones.
Child Protection in Crisis
9th July 2015
The child protection in crisis learning network has posted 2 photographs of a data collection project in Cambodia that uses Smap. I’m working on this project with Columbia University.
In the second photo I can only see pen and paper but the phones are definitely involved in this somewhere.
Floods in Solomon Islands
Solomon Star News
21st April 2014

Solomon Star News Article on use of mobile phones in response to flooding
Using Smap in Mozambique
Ivan Donduro
NO Monitoring and Evaluation Officer
WV Mozambique
October 20th 2013
Household Vulnerability and Resilience to Economic Shocks
February 2013
FieldTask has been very helpful to collect data for World Vision Nepal. We also used smap server even in the phone interviews during lock down. The enumerators used FieldTask tool to record the responses collected through phone interviews.
I have also published a research article from that data.https://www.nepjol.info/index.php/paj/article/view/31284