Tag Archives: DME

Conversational Surveys with Upinion

I have been looking at Upinion which seems to be a very nice tool for “Conversational Surveys”. Upinion define these as ongoing surveys conducted in a chat messaging tool such as facebook messenger or their own app. As a company Upinion are focussed on international development with the aim to “Amplify people’s voices in a crisis situation” and could be an excellent complementary information channel to use with Smap for getting a more complete view on a situation.

Upinion

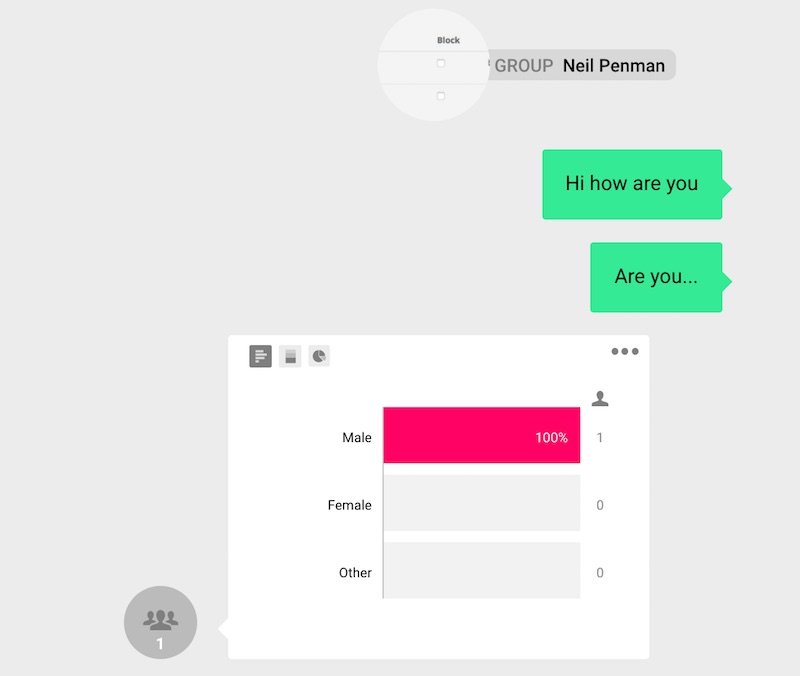
To specify the questions you are going to ask you create “conversations” using a GUI drag and drop editor. The screenshot below is from a test conversation I created. A graph of responses is shown automatically beneath each question as they are received.

Secondly you can attach a group to the conversation. This group will contain the respondents to your survey.

Finally you need to invite respondents to join a group. They might do this by scanning a barcode or clicking on a link. A key point is that the respondent needs to sign up in order to be involved in a discussion and they can revoke their membership and delete their personal data at any time.

Using Smap and Upinion together

There are a vast number of ways to collect data from the field, IOT devices, satellites / drones, surveys using enumerators, emailed or IVR surveys direct to respondents, conversational surveys as per Upinion etc.

The core Smap solution is the classic DME approach to conduct a survey with enumerators (we also support emailed surveys and webforms). This is probably the most rigorous and comprehensive way to get a snapshot of a situation at a point in time. However it does have a number of disadvantages. For example preparing the survey and collecting the data can take some time and has a reasonable cost. (Much quicker and cheaper than paper surveys though!). This cost and time tends to mean that you need to ask a lot of questions as you may not be back for a while and you are not sure what you need when the survey is being designed. Of course large numbers of questions can make responding to a survey time consuming for the respondents as well.

In order to get ongoing continuous data after the survey completes, the survey could identify people who have a smartphone and access to a network, and who would be prepared to act as a community contact or sentinel. They can be given a barcode to scan which will sign them up to an Upinion group. From that point on you can conduct conversations with these contacts to get a real time view of their situation and the situation in their community. Based on the information received you may then conducted another more targeted survey of the broader community using Smap.

Coordinating response to a rapid onset emergency using Smap Server

Smap Server, like many other mobile phone data collection systems, has evolved to support Design, Monitoring and Evaluation (DME).  However some of the features that make it useful for DME such as immediate analysis, flexible form design and inbuilt GIS also make it a powerful management tool.

This is the way that many of Smap Consulting’s commercial clients are using it.  These organisations tend not to go out and interview thousands of people using enumerators equipped with mobile phones instead they use use the mobile phone to suport their business processes. For example:

  • The city of Calgary is managing their water assets with Smap.
  • A petroleum company in Arizona is managing their plant and equipment with Smap.
  • Zarkman is supporting a building firm in Canberra that uses Smap to create inspection reports in PDF format.

Non Government Organisations have been using mobile phones for DME for years.  They are very well placed to use them to improve management processes.  These processes could be in any part of the organisation.

Scenario

Multiple organisations are collaborating in responding to the emergency.  Three of the tasks that might be required are illustrated in the following 3 videos (each less than a minute long).

  • Recording the plans for upcoming work including location and services to be provided
  • Coordinating actions with other organisations at a meeting
  • Assessing the effectiveness of interventions

Reporting on the plan

Letting other organisations, as well as people in your own organisation, know where you are operating and what service you will be providing at that location. So easy it can be done before you get your first coffee of the day. (well some people anyway!).

Note this video shows the use of an iPad application which hasn’t been released yet however the task can be performed just as easiliy in the iPad’s browser or any other browser for that matter.

Preparing for a meeting

Information from the plans of all collaborating organisations can be readily combined for reference at meetings.

Assessing Effectiveness

This is classic DME, however in the video the assessment data is combined with the planned interventions on a single map.

Calculating Nepali Date and Anthro Z-Score

Aaron Mok has contributed an example form that uses Nepali dates to calculate the age of a child and then calculates the Z-Score for that child using their age, weight and height.

nepali month

You can get the form and its attachments from here: https://drive.google.com/folderview?id=0B5_SmpWlQYxvTmFIcDkzSDIyaGc&usp=drive_web&pli=1&ddrp=1#

This form uses the pulldata() function to look up values in a CSV file.   pulldata() is not supported on web forms / enketo so you will need  to test it on an Android device.

I have loaded the form onto the demo server if you want to try it out without loading it onto your own server.

  • url:   http://demo.smap.com.au
  • username:  gplay
  • password:  gplay

Let me know if you find any errors in the calculation so Aaron and myself can fix them.

Release of fieldTask v3.0

Announcing fieldTask version 3.0. This release includes the changes in the odkCollect 1.4 release (thanks to the ODK team) along with the ability to send partially completed forms back to the server. You can download version 3 from google play and from the smap development server. It will be deployed onto other servers as they get upgraded.

ft3

fieldTask v3.0 Home Screen

1) Change Location. [Provided by ODK 1.4] There is a new ‘placement-map’ appearance for location questions.  If you use this “appearance” setting on a question of type “geopoint” then your current location will be shown on a map and you can do a long press on the map to change the position that will be recorded. The meaning of the 4 icons on the map is:

        1. Exit map without saving location
        2. Save location and exit map
        3. Place marker at current location
        4. Zoom to marker

location placement

2) New functions for date processing. [Provided by ODK1.4] Refer to the survey editing guideline and the example xls template.

3) Improved styling for phones with Android 3+. These will show an action bar with icons for some of the menu options. On smaller phones only one or two of the icons will be shown, the other menu options are accessible though the menu button.

icons

Android 2.2 phone menu showing all the icons. Android 3+ phones will show some icons on title bar, remaining menu options will be text when accessed through menu.

4) Access to question responses within repeating groups. [Provided by ODK 1.4].  This allows you to create one repeating group to get all the names of people in a household, then in a second repeating group you can ask detailed questions about each member of the household and refer to the name recorded for that householder. Refer to survey editing guideline and the example xls template.

5) Ability to defer constraint and “required” validation to the end of the survey. [Provided by ODK 1.4]. This can be enabled in the settings.

6) Sending partially completed forms back to the server.  If you have to save a survey half way through because it cannot be completed you can optionally send those results to the server.  After selecting “submit finished data” from the menu, press the menu button again and select “change view”. This will have two options “Show Complete Forms” and “Show Complete and Incomplete Forms”.  If you select the second option you will be able to see the saved incomplete forms and send them back to the server.

There will be an update to the server released by the 18th of October that will mark these incomplete surveys as “bad” with a reason of “incomplete”.  Hence they will not be included in exported spreadsheets or graphs unless the analyst marks them as “good”. If it is critical for you not to allow incomplete forms to be sent until the server is updated to mark them as bad by default, then defer use of fieldTask 3.0 until after the 18th of October.

Announcement of Smap Release – April 2013

Dashboard panels are now only viewable by the user that created them.  No more sharing!  The concept of sharing all dashboard panels worked reasonably well when a project team was working collaboratively on a project.  But there were still issues, for example when a team member wanted to do some experimentation with graphs.  However there were significant problems during workshops when 30 odd people were creating and deleting panels independently and the system was trying to keep all of the panels in sync.   So I came to the conclusion that no-sharing is better than sharing everything.   If anyone has any ideas on how to introduce some managed sharing back in to the dashboard panels let me know.

You can now specify address fields from the previous survey in follow up tasks.  See picture below:

tasks

fieldTask works a little differently.  The menu option “get new forms” now goes direct to the server.  If you want to delete forms or data from the phone you will need to select “delete forms” from the main menu.  

Other changes:

  • More informative error messages when uploading templates
  • Surveys can be set in settings to automatically upload when they have been completed (with odk1.3)
  • In settings you can specify the use of forward and next buttons instead of swiping (with odk1.3)
  • Vertices of polygon questions are now shown on map panels.  Apart from allowing the user to look at question responses on each point of the polygon the display of these points make it easier to find small polygons on the map.  (This one for Mark)
  • The usual assortment of bug fixes