
Exporting survey results as Flat or Pivot
Prior to August 2013, surveys could be exported as either “flat” or “pivot”. If “flat” was selected then all the repeating records for an instance of a survey were flattened and made to appear in the same output record giving one line per survey instance. If “pivot” was selected then each entry in a repeat group caused a new row to be created in the output.
Example Survey
The examples in blog page are from a survey that uses the following template.

It contains three repeating groups. Two of them, “household member” and “vehicle”, are under the top level form. The third one, “fault”, is under vehicle. I completed this survey twice using fieldTask (you can also use odkCollect) entering the following data:
- Suburb for Household: Brunswick
- Household Member: Sally, Age 25
- Household Member: Joe, Age 35
- Vehicle: Toyota
- Fault: Brakes
- Fault: Engine
- Vehicle: Hyundai
- Suburb for Household: Northcote
- Household Member: Ken, Age 35
- Household Member: Sue, Age 40
- Vehicle: Holden
- Vehicle: VW
- Fault: Wheels
Flat Export Example
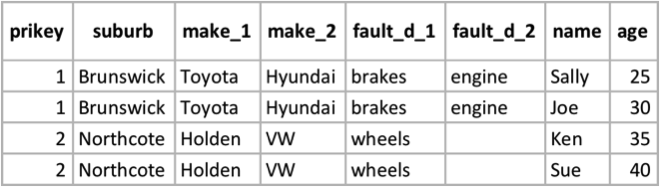
Exporting the above results as a “flat” export gives:
![]()
You can see that all of the repeating elements have been flattened so as to appear on the same row for each survey instance.
Pivot Export Example
Exporting the results as Pivot gives:

Here are a record is created to show the relationship between all the combinations of answers that are recorded at the same level in the survey. So each member of a household is combined with every vehicle.
Problems with this basic approach
The major problem with exporting an entire survey as “flat” or “pivot” is that the datasets can get very large making it difficult to know how to start the analysis. For example in a large hospital audit that I am working on in the Solomon Islands, there are 5 repeating group in each survey instance recording details on each area of the hospital (approximately 20 areas), on visits to and from the hospital by staff, on staff members and a repeating group of photographs. These can easily generate over a thousand rows of data for every hospital visit in “pivot” format or 5,000 columns in flat format. Potentially it could be difficult to extract the information you need to analyse from this mass of exported data.
New Survey Export to Spreadsheet
The August 2013 release of Smap adds 2 features, firstly the repeating groups to be exported can be selected so that analysis can focus on part of the data set, secondly individual repeating groups can be selected to be either “pivot” or “flat” within one export. However you can still export all the data as “pivot” or all the data as “flat” giving the same output as before.
Selection of Repeating Group Examples
Top form and Vehicles
Select:

Results:

Vehicles and Faults
Select:

Results:

Selective Flattening of Repeats
Vehicles and Faults Flattened
This time the vehicles and faults forms have been set to flat.

Results:
The output shows a row for each member in the household. However the data from vehicle and fault for the household are included with a set of columns for each record in those groups. Because the data has been flattened the relationship between vehicle and fault is not shown.
This is very helpful