Announcing the release of version 14.05. If you are installing or upgrading you can download from http://www.smap.com.au/downloads.shtml. I’ll be rolling this release out to other servers I manage over the next week.
New Features
Humanitarian Openstreetmap Layer (HOT)
You can make HOT the background map on a map view by selecting the expand button labelled as “<“. You will then see a list of the available map backgrounds including openstreetmaps, google maps, google satellite and now HOT.
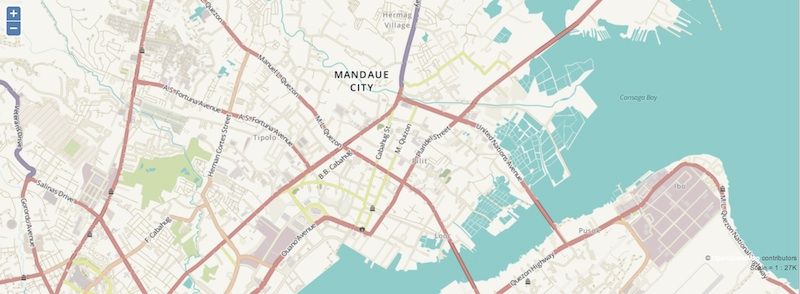
HOT Map Background Layer
The data on the map is the same as standard Openstreetmap however it is styled to show features in a way that is more relevant to aid workers.
Webforms
These has been updated to use the latest version of Enketo core which includes new features for collecting lines and shapes.
You can also add an appearance of “likert” to a select_one question to get the options displayed on a Likert scale. 
Although webforms are now fairly mature I would not recommend their use in large critical offline surveys just yet. In recent testing there were issues with slow response to user actions on even quite small surveys and in some browsers on some devices there were crashes when accessing location. However feel free to try then out and share your experiences.
Results Filter
You can specify a filter on results. For example as well as say, requesting a graph of problems by region, you can also specify that only results from women are returned. Currently this where filter only works on select_one, select_multiple and text questions. However it will be extended to other types of questions in a future release.

Settings Popup
If you click on the “Filter By Value” button on the settings popup, then you will be able to select the question to filter by. Unfortunately at the moment you can select any question even though only the select_one, select_multiple questions and text will work.
Once you have set a filter on an analysis panel / view then the “filter By” Value” button will be green and the filtering will be included in the results description. To remove the filter select the “Filter By Value” button and press “clear”.

Filter popup
Miscelaneous Changes to Analysis
- Paging of results. The forward and back buttons no longer scroll with the results so you don’t need to scroll all the way back to the beginning in order to select these buttons.
- Total function. Previously if you had a numeric question and you wanted to see results grouped against another question such as region, then you could only get the “average” value per region. Now you can get the “total”. For example the total area of all the farm plots by region.
- Specifying units in server side calculations. You can now specify units in server side functions. An area function can return results in Hectares or meters squared. A length function in kilometers or meters. These units are shown on graph labels. Because you can now select the units the number of places after the decimal point has been limited to 2.
- “Bad” records are no longer shown in Map and Media views. Previously if you looked at the whole of survey results then you would see the records that had been marked “bad” on the map. If you want to review bad records the only way to do that is to create a table view for the whole of the survey, that is do not select a question.
- The default title of an analysis panel is now set from the survey name if the user does not provide a title.
- Analysis panels shown in expanded view are, nearly, full screen. The only part of the web page that can still be seen, apart from the expanded panel, is the main menu across the top.
- This button on the analysis page, has been replaced by 4 buttons each with a picture of the type of view / panel that is to be created; Graph, Map, Table and Media.
CSV Exports
CSV Exports have been replaced by a new function that is much faster. Its faster both to export the data and to download it as the csv file is zipped before downloading. It is highly recommended that you use this instead of the XLS export when you have large numbers of results. The main restrictions compared to exporting as XLS are
- Some formatting is not performed
- Only a single form can be selected and this form will be exported along with its parent and so on up to the top level form. So you can’t export data from more than 1 form at the same level in the hierarchy at the same time.
- You can’t specify that a form will be exported as pivot or flat. Effectively all the forms are exported as pivot and the number of records will be equal to the number of records in the selected form.
The above sounds more complex than it is. If you try it then it should be obvious what is happening.
Exporting Surveys with Polygons and Lines
When exporting results of a polygon or line to excel the individual points are no longer included by default. You can add them in if you like but this can make the exported spreadsheet large as in a pivot export an extra row is created per point.
Changes to Installation of the Server
- Database upgraded to Postgresql 9.3
- Support for Ubuntu 14.04 added
- The need to set server IP address during install has been removed. To install Smap on ubuntu you now just need to type ./install.sh into a terminal. This change is in part to support installation on laptops where IP addresses change with each network that you connect to.