I’m still playing catch up on documenting the new features however its time to announce version 18.01. Included is a summary report that helps with analysis of your collected data.
Summary Report
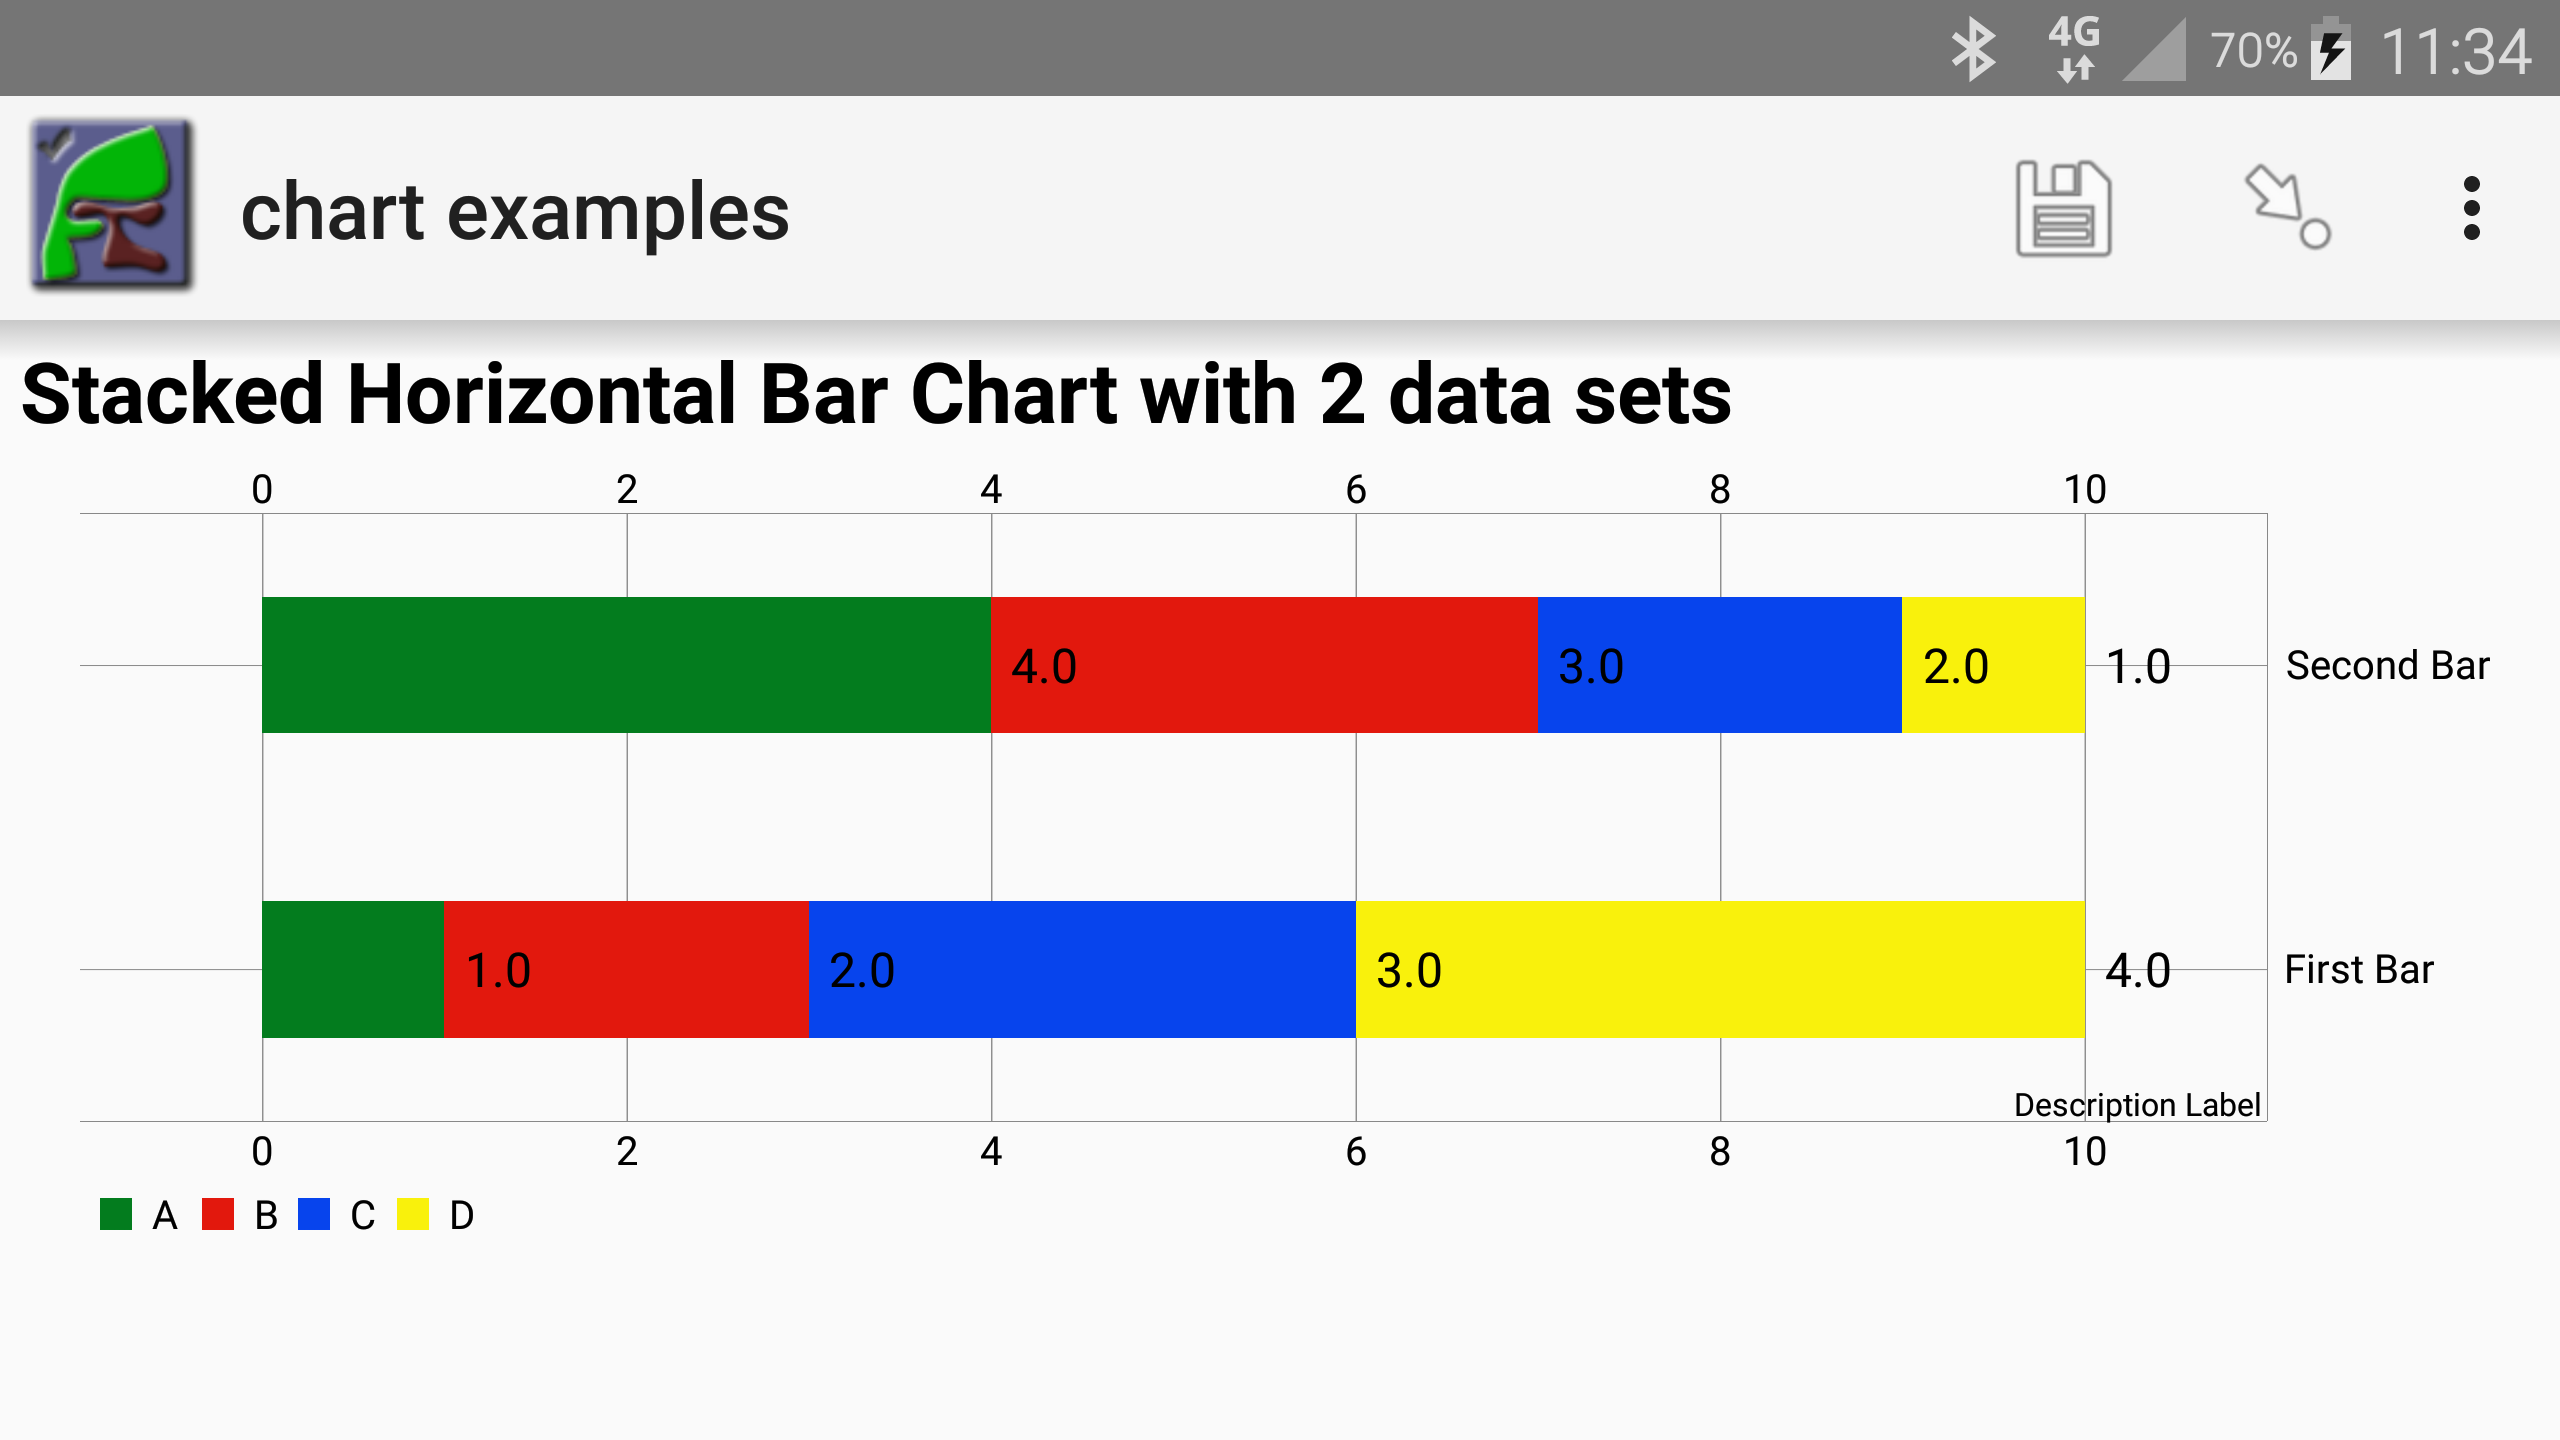
This is an excel file containing multiple worksheets including a worksheet for each question. The data in these question worksheets will be formatted so that they summarise the responses to that question and can be be used directly to create charts. For Example the following chart was created directly from the data generated by the summary report.

How to find it
The Summary report is located on the browse results page which is in the web forms module.
- Login
- Select the menu modules then Webforms
- Select the menu Browse Results
You can then select the menu “Summary Report”.
Options
The following dialog allowing you to customise your report.

- Text Function. This can be set to count or percent. So if its “count” then the occurences of each different piece of text in an answer will be counted. If you select “percent” and “Group By” then the percentage is calculated against the total count for each group value. This was the setting used in the example chart shown above where the totals for male and female have been adjusted to each add up to 100.
- Numeric Function. This can be set to Average, Min, Max or Sum.
- Group By. A second question with which to group the results. This will result in a two dimensional table as in the example above.
How to use it
The summary report is not intended to create your final report directly. For example you may want the answers to some questions grouped by gender and the answers to other questions grouped by region. Some results you may want as percentage, some as counts and some as both. Hence you would generate multiple summary reports using the above options and then copy and paste the tables, and charts you create from those tables, into your final report.
Filtering Data
Because the summary report is on the browse results page any filters you apply will also be applied to the report. Hence you may select that only data from a specific region where at least one text answer includes the word “drought” be included. Then generate the report. The above filters will be shown on the “settings” tab of the summary report along with the numeric function, text function and group by that were selected.
Restrictions
Currently only data in the top level form is included. If you have data in sub forms it won’t be included in the summary report. This is because browse results only currently shows the top level form. This restriction will be removed in a future release.