Category Archives: Smap Hints

Hints for using Smap

Upgrading from Oversight Forms to the Console

The new console release is not backwardly compatible with Oversight forms so once your server is upgraded you will need to start using the new approach. Here are some tips:

Using the console

Oversight forms used to be attached to a standard form. Each form could have only one oversight form. Hence when you went to the managed forms page and selected your form all the oversight form’s data was also immediately visible,

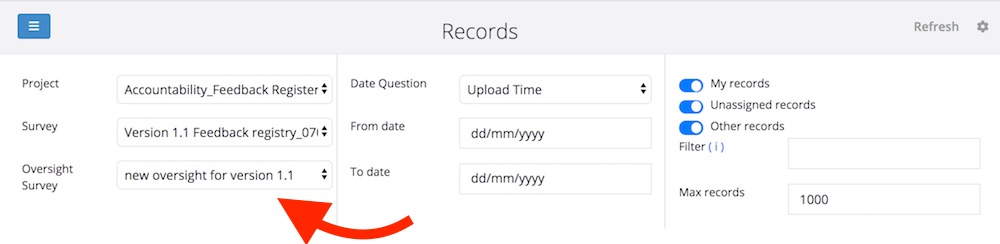
The console is more flexible, more options for the user and hence a little bit more work for them to set up what they want. When you go to the console the first time only the data for you current form will be shown. However you will see a drop down that allows you to select your “Oversight Survey”. Change this from “none” to the form that you want to use to edit your data. Once you have done that you will see the oversight questions as before. The selection you made should be remembered.

Selecting an oversight form / survey

Editing data

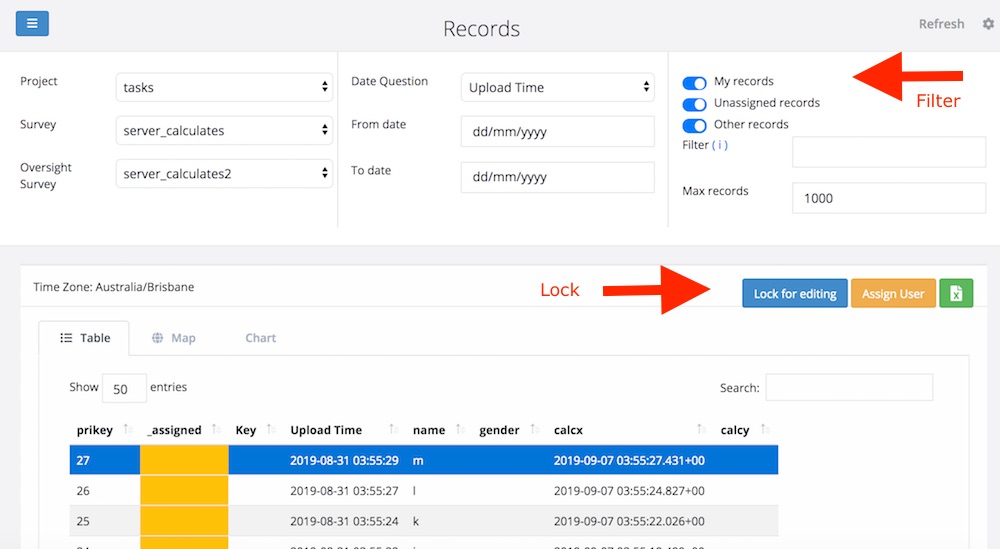
In the previous approach to oversight forms you could select a row and edit it. Now if you want to change a record of data you need to first lock it. So select the row then select the “Lock for Editing” button. This will assign you to the record so that you can make changes.

You can see who is assigned to a record in the _assigned column. This column is color coded:

  • Yellow if the record is not assigned
  • Blue if it is assigned to the current user
  • No color if it is assigned to someone else

Records assigned to someone else can only be viewed they cannot be changed. An administrator can reassign records to a different person. You can filter out records assigned to other people using the switches at the top right of the screen.

A view of the console showing the lock for editing button and the switches to filter by locked and unlocked records

Modifying the Oversight Form

Oversight forms are no longer anything special. They are just any old form that you want to use to edit data in the main form. To do this the questions in the each form would need to have the same name. The forms also need to be grouped.

Because oversight forms are like any other form you manage them from the form management page. When you upload the oversight form select the form that it will modify using the “Group” drop down.

A convenient way to create an oversight form might be to take a copy of the form you are going to manage and then add / delete questions as required.

Information Management

Smap’s advanced capabilities in; linking data between forms, task management, unique key management, case management and notifications allows you to connect forms in order to create an information management system.   That is a set of collaborating forms that address one or more business processes in your organisation.

To illustrate this capability I have created a demonstration of a system that supports the registration and enrollment of students in education classes.   This demo is available on the Smap https://sg.smap.com.au server for you to try out.

The attached pdf provides detailed instructions on how to try the demo.  Hopefully this example will inspire you to create your own information management system using Smap.

Click to access studentEnrollment+minimal.pdf

Adding Artificial Intelligence to your forms

Single-layer feedforward artificial neural – By Akritasa [CC BY-SA 4.0 (https://creativecommons.org/licenses/by-sa/4.0)]

Smap Forms are a great way of implementing what used to be known as “Expert Systems”.   While you are collecting data with a Form questions can be displayed or hidden based on their perceived “relevance”.   In the same way recommendations and feedback can be shown based on the answers that have been provided.  If A and B then show C.

One reason that this is great with Smap is that the expert advice can be embedded easily in a system whose primary function is the humdrum capturing of information.  It is not necessary for the user to sit down for a dedicated session of receiving expert advice.  Another reason is that a domain expert can create these forms without needing input from a programmer.

However these rules are a long way from Artificial Intelligence.  Once your form has collected the answers to 20 plus questions as multiple choice, text, audio, images and video then there may be critical information that you want to feedback to the user immediately hidden in that data that you cannot extract with a few “if” statements.

Version 5.5 of fieldTask (available from the google play store) adds the ability to call a server passing it data you have collected and to get back a response that can be used to guide the next steps.  You need to be filling out the form on line of course and the service you call need not be an Artificial Intelligence web service, it may just look up reference data, however we see the use of AI services in this way as particularly compelling.

You can try this out in fieldTask by adding a “calculate” that calls a lookup_image_labels() function.  So in an xlsForm your questions might look like this:

type           name                      label / calculation
image        scene                      Take a photo
calculate   scene_objects        lookup_image_labels(${scene})
note           show_objects        Objects in photo are: ${scene_objects}

And this is what the above form looks like on the phone.

Firstly Take the Photo

And here are the objects that were identified

Well this is not actually very useful!

The AI service called by lookup_image_labels() is the AWS Rekognition service that can identify things in photographs such as cars, people, computers, desks etc.   Even that task is done far from perfectly, it did not identify the  bowl, unwashed or otherwise.  And it will probably identify nothing that the person filling in the form could not identify for themselves.   This information would be useful on the server in order to search for images  but you can already generate these labels automatically, using Smap, once the form has been submitted.  It hardly seems necessary to make the person completing the form wait for these labels to be returned from the server.

So why do it?

Well actually the Rekognition service is just an example.  We can add calls to your custom AI engines that can identify patterns in the data or images and that may be critical in identifying the advice to be provided or the further information that needs to be collected.

Smap can be used to collect the data required to train an AI engine and now it can use the decisions from that AI engine in collecting more data creating positive feedback to add value to your processes.


Hint: Changing the question after you have started collected data

The replace button on the form management page lets you replace one survey with another at any stage of the data collection process.  There are no restrictions on what you can change and this can cause some issues if you change a question type.

For example a customer had a question in their form “How far away from home is your work?”.  They originally specified this question as “decimal” and had collected data where it was recorded as 3.0, 4.5 etc.  However they later changed the type of the question to “text” and the submitted results contained values like “5 minutes”.  Unfortunately these results were not being applied to the database so they could not see the later results.

Cause of the Problem

Once you start submitting data for a form, a table is created to store that data.  The answers to different types of questions are stored differently:

  • integer question answers are stored as Integer
  • decimal are stored as double precision
  • text, select_one, select_multiple, barcode, image, video, audio are stored as text
  • geopoint are stored as geometries

So if you then change a text question to a select there is no problem but if you change an integer to a text then the data will not load.

Detecting the Problem

The monitor page will show the the errors and list the results that were not loaded.  To see these:

  1. Select the “Admin” Module
  2. Select “Monitoring”
  3. Set the source to “Submitted”
  4. Select “Show Instances”
  5. Select your project and survey if there are a lot of submissions from other surveys shown

The errors indicating a problem with the question type will look like:

ERROR: invalid input syntax for type double precision: “5minutes” Position: 127

So a bit cryptic but a problem with question type.  Its trying to write some text into a decimal question’s database column.

Fixing the Problem

Usually the problem can be fixed simply from the Analysis module.  Open a table view of your survey.  This will show the results that have been loaded.  Click on the icon “<” at top right to open the aside.

There are two useful buttons here: “Delete Data” and “Restore Data”.  However note the “warnings” section below before using them.

Case 1: You are still testing the form

If you are still testing the form select “Delete Data”.  As well as deleting the test data this will also delete the tables that store the data so next time you submit some results it will recreate these tables but using the latest question types.

Case 2: You have some valuable data loaded (or submitted)

In this case select “Restore Data”.  This will also delete the tables but it will then reload all of the data from the original submissions.

Warnings

Using “Restore Data” will

  1. delete any modifications you may have made to data after it was collected.  For example fixing spelling mistakes using the modify page.
  2. resend any notifications attached to your survey.  For example you may be sending an email with a PDF containing details on each uploaded record.  If you don’t want these emails to be resent then you can disable notifications while you do the restore.  However any records that had failed to load due to the question type change will then also not trigger the notification. So tricky.

Taking note of these warnings it is a good idea to change the data types of questions with care.

Zarkman Mobile for Android, iPhone and iPad

Zarkman Mobile is now in the google play store and Apple App store (search for zarkman) .

zm1

Pre-Requisites

An Android phone with Android 2.3.3 or greater.

You need a hosted Smap Server that has version 15.09 or later.

Getting Connected

By default ZM is configured to connect to the Zarkman application server.  To connect to a Smap server you need to:

  • Select the menu. This is the button with 3 horizontal lines at the top left of the app.
  • Select “Settings”
  • Enable diagnostic mode.  (I need to change this label, its not just for diagnostics, although this is how I switch to my development server for testing).
  • Enter the name of the server into the “Test Server” box.   To use sg,smap.com.au just enter “sg”
  • Select change server
  • You will then need to logon
  • If you don’t have a user account on the sg server you can use:
  •     user: zm_test
  •    password: zm_test

Synchronising with the server

Either drag down on the forms screen or press Menu | Refresh

This will get new forms from the server and submit finished results.

Other Actions

  •  Select a form to complete it.
  • Select the records tab to view completed forms
  • Swipe left on the records tab to make a completed form into a template

Managing School Enrolments with Smap

Sometimes your forms need to change quickly.  One such case was suggested by World Vision staff who are working in Syrian refugee camps.  They wanted to record school attendance however new children are arriving daily and hence the attendance roll would be also changing daily.

Putting choices in a CSV file separate from the form can be the answer.   The file name is specified in the “appearance” column.  In the example below the choices will come from the “children.csv” file.  The other parameters to the “search” function are filters so that only children in “class1” are included.

enrol1

Select Question Getting its Options from a CSV File

Choices in external CSV files have been available for a while, however the January 2014 release of Smap will have the following enhancements:

  • Support for select_multiple.  Previously only select_one worked,
  • You can now analyse select questions with external choices in graphs, tables and maps on the analysis dashboard,
  • and, CSV files can be attached to a single form or shared by all forms in the organisation.

Demonstration

This demonstration shows information on new school enrolments being collected using a form and then being added to a CSV file.  This file is then used to record attendance in school and is also used by a separate form to record vaccinations given to the children.

The data can be used in multiple forms because it is loaded to the “Organisation” tab in the media page rather than the “Form” tab. If you loaded different files with the same name to “Form” and “Organisation” then the file at the “Form” level will take precedence.

The files for this example can be found here.

Process

  1. A school teacher uses fieldTask and a form called “enrolments” to record school attendance.  Any new children arriving that day are recorded in a sub form.  (using “begin repeat”)
  2. The back office team copy the details on the new children and put them into the “children.csv” file.  They upload this file to the Smap server where it replaces the existing file.
  3. The next day, before recording attendance, the Teacher presses “refresh” in fieldTask to get the latest form. They can then mark off the attendance of all the children including those that arrived the day before.
  4. A medical specialist using a form called “vaccinate”, presses refresh in fieldTask before checking the children in a class.  This will load the latest vaccination details into their phone.

CSV File

enrol2

Children CSV file

This process is shown in the following video

Automation (Future)

The video showed a back office worker manually copying the daily enrolment data into the children CSV file.  This task could be automated by implementing a custom web page.  Apart from saving some effort for the back office administrators this would also apply updates faster resulting in more current data.

Other Applications of CSV files with Smap

CSV files storing data can be used in other applications, not just for school enrolments and vaccinations.  For example asset management, managing workforce etc.

Moving a form to a different project (New in 14.08)

This is a new feature in version 14.08.  You may find that you have too many forms in a single project which is confusing to the data collectors as they may not be sure which form they need to download and complete.

You can create additional projects in the user management screen and then move some of the forms into one of the new projects.

1. First click on the form name in the template management screen.  This will take you into the form editor.

settings

Settings page of form editor

2. Select the project that you want to move to

3. Click on the “Save Settings” button

This will change your default project to the new project so if you want to move another form you will need to select the old project again then repeat the process


Areas and lines on webforms in version 14.05

Version 14.05 of Smap Server, due at the end of May, will support the drawing of areas and lines on top of maps.

shape

Completing a geoshape question in webforms

trace

Completing a geotrace question in webforms

Specifying the questions

You can add these questions in xlsform editor.

  1. For an area set the question type to “geoshape”.
  2. For lines set the question type to “geotrace”
  3. Set the appearance to “map” if you want to allow the data collector to select coordinates on a map as well as record location from their current position

Here is a sample form

One form per location question!

Don’t forget to put each geopoint, geoshape or geotrace question in a separate form.  The reason for this is that GIS systems assume that each table has a single location column and that all of the other columns are attributes of that location.  In Smap, 1 form becomes 1 table.  For example if you were recording the location of a water point and a household in one survey you would collect the household data in one form and then the water point data in another form.  The household form would contain the location of the household as well as the “attributes” of that location which is the other data about the household. The same goes for the water point.  In Smap you specify a different form by enclosing the questions in “Begin repeat” – “End Repeat” question types.

Use of geolinestring and geopolygon

Smap has had the ability to record areas and lines for some time using the geolinestring and geopolygon features.  These are still available and are useful in the following circumstances:

  1. You are using fieldTask which doesn’t yet support geoshape and geotrace
  2. You want to record data on each point.  For example you may want to record a temperature or a take a picture at each point of a line that you are recording.  Geolinestring and geopolygon allow you to add arbitrary questions to each point that is recorded.

Setting the default language

One of the new features in version 13.12 of the Smap Server is the ability to set the default language.  Previously this was always the last language entered in the survey work sheet.

There are two ways of setting the default.

1. The xlsform standard way is to add a new worksheet “settings”.  Provide a single column with a heading of “default_language” enter the default language under that column.

lang1

Default Language in Xlsform

2. The other approach is to specify the default language directly in the smap server.  You can change the default here any time without having to reload the template.  You do this from the template management screen. Select “view/edit” next to the name of the survey you want to change.

lang2

Default language on Smap Server

Then select the default language from the drop down list.


Creating Time Series Graphs

With the release of version 13.12 of Smap Server you can create graphs, maps and tables that show data against a time axis. This post describes a series of steps that proceed from a very simple bar chart to a, still simple, time series graph.  You can of course create these time series graphs in one step however you might use this approach of progressively refining your settings in order to show progressively increasing details.

The data in the examples is artificial and is from a survey that collects water depth in a well from two different  locations.  The water depth question was of type “integer”, the location question was of type “select_one”.

1. Bar chart of water depth

First select “Add Panel” to create a new panel, select your survey, and your question then press the “save” button. You will see something like the following. This shows the average water height for all locations at all times.

g1

Bar Chart

2. Bar chart of Water Depth by Location

Then specify the location as the “group by” question. This will show the average water height at each location for the entire time of the survey.

g2

Bar chart with “group by”

3. Time Series Plot of Water Depth by Location and Day

Then select the date question to use as the x-axis. This settings field is just under the name of the survey. Also select a period for the time axis. In this example I selected “day”.  The settings panel will then look something like this:

s1

Settings Dialog Configured for Time Series

The resultant graph shows average water height per day and per location. Note the gap in data between the 14th of January and the 5th of February.  No measurements were taken during this period.

g3

Time series chart by location by day

 4. Time Series Plot of Water Depth by Location and Week

If you then open the settings and change the period to “week” the x-axis of the graph will be updated so that average water height per week and per location is shown.

g4

Time series chart by location by week