Author Archives: Neil Penman

Version 14.03 now available for download

You can download the server application from http://www.smap.com.au/downloads.shtml

This is a major release and if you are upgrading from a previous version I recommend that you backup your database first. Also if upgrading you should add the following directive to /etc/apache2/sites-available/default and /etc/apache2/sites-available/default-ssl.  This will make the fieldManager javascript files available to people accessing reports without requiring them to enter a password:

<Location /fieldManager/js>
allow from all
Satisfy any
</location>

This release has been tested with Ubuntu 12.04 LTS.  There may be some issues with web forms when using Ubuntu 14.04 or any other Ubuntu version that uses Apache 2.4.


Smap Version 14.03 Forwarding

Smap version 14.03 has finally been released.  It should have been available from the end of March. The next release should be a small one and hopefully we can get back to the end of month regular release date.

The major new feature is forwarding of surveys.  Other changes are improvements to monitoring, support for larger result sets (paging) and a more laptop friendly deployment.

Monitoring

Totals

When you select “Monitoring” by default you will be shown total counts for success, errors, duplicates and “not uploaded”.

monitor

Totals are only available in Table view.  In order to view locations of uploaded data you need to first select the source as “Instances” then select “show as map”.

Filtering

You can filter the uploads (or forwards) that you view in the monitor page by their status. Success, errors, duplicates and “not uploaded”.  Hence you can uncheck all statuses except for “Error” in order to see which uploads in your project or survey were reported as being in error.  When showing instances rather than totals the last 200 records are still shown.  However if you apply a filter to only show errors then it will be the last 200 errors that are shown.

Paging

Paging is now available in the Monitoring screen and for the survey table view in the dashboard.  200 records are shown by default but you can then select a forward / reverse button to move forward and back through the results. These buttons are located at the top of the table and are labelled “>>>” for forward and “<<<” for back.  They will be disabled unless there are additional pages available to view.

Total Result Records

In the dashboard, when you view all survey results as a table, then the total count of surveys will be shown as well as the count of “bad” records. This wil be a faster way of getting a count of all surveys loaded than having to export to a spreadsheet.

Deployment

Changing URL of the server

Previously it was assumed that the address of the server would not change.  This allowed the server to get away with storing the full url of all survey attachments in the database.  However this assumption is completely untenable if Smap Server is deployed on laptops.  The server URL can now be changed and all the attachments will still be accessible.

Simplified deployment

Almost all the editing of files that had to be done during the installation process is now not needed.  The one exception is that the IP address of the server still has to be set in the install script.   This is only required for webForms and will hopefully be removed soon.  So, assuming you are installing on a clean Ubuntu machine, the new installation process is:

  1. Download and extract the release
  2. change directory to smap/install
  3. Edit the install script to add the IP address (temporary)
  4. Type ./install.sh

This will also now run the deploy script so once it finishes you shoulld be able to log on and use the server.

This release will be added to the downloads page over the coming weekend.  There will be another blog post to announce its availability.

Bug Fixes

  1. Error in retrieving languages on the audit page fixed.  This bug prevented auditing.
  2. If the first record in survey had an invalid geometry then export to shape files would fail. An example of an invalid geometry is recording only one point when a polygon or line was requested.


Forward Results to another Server

Beginning in Smap version 14.03 you can add forwarding to a survey template.  This will result in each submitted result being forwarded on to the target server.

Key characteristics

  • Each forward link sends results from a single survey template to a single remote server
  • You can add multiple forward links to a template allowing you to forward results to many remote servers
  • Submissions are sent in one direction only. Hence if the target server is receiving results from multiple sources it will have a different view of the results than each of the sources
  • Forwarding links can be added to the target server as well. These can point back to the original source server but it ahs to be to a different survey on that server
  • Existing results will be forwarded if you add forwarding to a template that already has submitted results
  • Results will queue until there is a network connection before being forwarded
  • The target server can be another Smap server or any server that supports Java Rosa such as ODK Aggregate

Offline laptops

One way of using this forwarding feature is to install Smap on a laptop.  This laptop can be used to aggregate and analyse data collected on mobile phones in areas that do not have a reliable Internet connection.  You can upload the results from the phones to the local laptop over a wi-fi hotspot.  Once you connect the laptop to the Internet it can forward the results onto a cloud server so that they can be worked on by a distributed team.

Community Laptops

image (6)

Community laptops are an extension of the “offline laptop” concept.  Each community can maintain its local view of data collected on the phones.  However they can set up a forward link so that a consolidated view of all the data from all the communities can be aggregated.

Demonstration

The following video shows the forwarding of results from a Smap Server to an ODK Aggreate server.

How to add a forward link

  1. Create the same survey template on the local and remote server.  These templates can have different names on each server but should be the same template.  A good way to do this is to download the template as an XML file from one of the servers and then upload it to the other.
  2. On the source server, find your template on the template management screen and click the upward pointing arrow next to its name
  3. Click the button “Add Forward”
  4. Enter the url of the destination server
  5. Enter a user ID and password.  You should use a user id that only has privileges to complete surveys (enum) as the password is stored in the database. So don’t use your Admin user id!
  6. Press the button to refresh the list of available surveys on the remote server
  7. Select the survey that you want to update
  8. Save

You can monitor forwarded results on the monitor page by selecting the “forward” radio button.

Smap version 14.02 Multi Tenant

Announcing the release of Smap Server version 14.02.  The major new feature is that multiple organisations can now be put on a single installation of Smap, so called multi-tenant.  The administrators or analysts in each of these “organisations” cannot see projects or surveys in any other organisation however within each organisation the administrator can still create projects and users.

Multi-Tenant

When you install the Smap server it will create a user with a login id of “admin”.  This user has the “organisational administration” role.

multi1

If the user has the organisational admin role, they will be able to add organisations and move users and projects to other organisations.

multi2

  1. Select “Add Organisation” to create a new organisation
  2. Select users and projects then click “Move” to move these projects and users to a different organisation.  The Organisation Administrator can move themselves as well as other users.

Users, including administrators, without the organisational administration role will only be able to work within the organisation that they have been assigned.  Each user can be assigned to only one organisation.

The name of the organisation is shown after the users name at the top right of each screen.  An ‘@’ symbol separates the organisation name from the person’s name.

multi3

Export surveys with location as KMZ or VRT

Two new export formats have been added in this release.  Due to the increasing number of format options the radio buttons that were used to select the format have been replaced by a drop down selection.

  1. KMZ / KML files can be loaded directly into Google Earth.
  2. VRT files are accompanied by a CSV file holding the data.  This is useful for geospatial processing including being imported into a GIS such as google maps engine. VRT is a document format used for describing vector or raster geospatial data. In this case the actual data is in a CSV file and the VRT file identifies the type of geometry (Linestring, Polygon or Point).

    Smap can also export shape files however they are limited to 255 attributes and even worse the length of the attribute name is restricted to 10 characters which results in attribute names being truncated and difficult to differentiate. Whereas the overall limit on the number of attributes per feature in google maps engine is 550 with a maximum name length of 64 characters.

Check on maximum questions per form

There is a limit of 1,600 columns in each database table.  Because the results from each form are put into separate database tables then this imposes a limit on the size of each form. Each question is stored in its own column and also each option in a multiple choice question gets its own column.  10 columns have also been reserved for the unique key, key to the parent table, start date, end date, device id and user identifier.

When uploading a template the server now checks the number of questions and multiple choice options and will report an error if there are too many.

msg

Example error message when there are too many questions in a form

Fortunately it is straightforward to move excess question into another form and this should not affect either data collection or analysis. More details here.

Allow access to attachments without an account

The default installation no longer requires a user to have a valid user id and password to view an attachment such as a picture.  Instead each attachment has a name created from 28 random characters.  For example: 4e2252ad-39db-46cb-b50d-aubb94ca353a.PNG. This will simplify integration with other systems while still preventing unauthorised access to attachments.

Some Bug Fixes

  1. Template files with a suffix of “.XLS”, that is in capitals were not being identified as Excel files. Now the test is case insensitive and file extensions can include capitals.
  2. Results from surveys with unicode characters, that is Arabic, Chinese, Japanese, Thai etc, could not be be exported.  These can now be exported and the name of the download file will be the same as the survey name.

Controlling access to survey results

There are 3 roles that can be given to users od Smap Server:

  1. Admin.  Can create new projects and assign themselves, or any other user, to projects
  2. Analyst.  Can view and export results, create graphs, load new survey templates.
  3. Enum. Can download survey templates to a phones and submit results.

Hence you can restrict a user from accessing surveys that they are not involved with, by putting surveys into projects.  Users can then be assigned only to those projects that they are allowed to access.  As long as the user does not have the admin role then they will not be able to give themselves access to other projects or create new projects.


An issue with the current solution is that you may have multiple areas of your organisation that work independently hence you will want to create a user with the “Admin” role for each area.  But these admin users will be able to view and delete survey data collected by other areas.

The next release of Smap Server (14.02) due in late February will address this issue by adding the concept of an “organisation”. Even admin users, within 1 organisation will have no access to data in other organisations.  You will be able to create an organisation for each area of your company.

Smap Version 14.01 Task Management

Announcing the release of Smap Evaluation Tools Server version 14.01.  This release includes

  • Task management: the ability to filter the surveys that are used as locations for new tasks
  • Task management: Printing of task allocations across multiple pages
  • Support for Internet Explorer 10+ as the browser
  • Improved reporting of errors when uploading templates

Task Management

Task Filtering

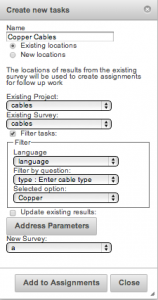
When you create new tasks from an existing survey you can now specify a filter on one of the questions in the existing survey.  Only survey locations that match that filter will be added to the new task group. Select the checkbox called “Filter tasks” to enable filtering.

tm1

Task Filtering


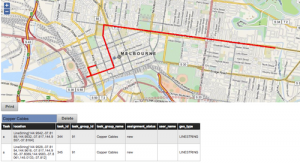
In the following example the previous survey recorded the paths of various cable types including copper and fibre.  However for the new task I only wanted the surveyor to go to the cables of type copper so I enabled filtering and selected the option of “copper”

tm2

Tasks filtered by cable type of copper

Printing Task Sheets

When you select the “Print” button to print a task sheet the tasks are now shown on more than one page.  This attached PDF shows this. Note the address parameters that have been added to help locate the location of each task.  In this case these include the age, ethnicity and a picture.


Setting the default language

One of the new features in version 13.12 of the Smap Server is the ability to set the default language.  Previously this was always the last language entered in the survey work sheet.

There are two ways of setting the default.

1. The xlsform standard way is to add a new worksheet “settings”.  Provide a single column with a heading of “default_language” enter the default language under that column.

lang1

Default Language in Xlsform

2. The other approach is to specify the default language directly in the smap server.  You can change the default here any time without having to reload the template.  You do this from the template management screen. Select “view/edit” next to the name of the survey you want to change.

lang2

Default language on Smap Server

Then select the default language from the drop down list.


Smap Version 13.12 available for download (and new download Site)

You can now find a list of Smap Server versions available for download at http://www.smap.com.au/downloads.shtml. Version13.12 as well as training documents are now available from that location.

Older versions of the server can still be downloaded from the Google code site.  https://code.google.com/p/smap-suite/downloads/list. Search for “Deprecated Downloads”.

The download is actually hosted on Amazon S3.  This move was required because Google no longer allow new downloadable files to be added to https://code.google.com.  Hence the training documents have all been moved to google drive and the large server files to Amazon S3.

Creating Time Series Graphs

With the release of version 13.12 of Smap Server you can create graphs, maps and tables that show data against a time axis. This post describes a series of steps that proceed from a very simple bar chart to a, still simple, time series graph.  You can of course create these time series graphs in one step however you might use this approach of progressively refining your settings in order to show progressively increasing details.

The data in the examples is artificial and is from a survey that collects water depth in a well from two different  locations.  The water depth question was of type “integer”, the location question was of type “select_one”.

1. Bar chart of water depth

First select “Add Panel” to create a new panel, select your survey, and your question then press the “save” button. You will see something like the following. This shows the average water height for all locations at all times.

g1

Bar Chart

2. Bar chart of Water Depth by Location

Then specify the location as the “group by” question. This will show the average water height at each location for the entire time of the survey.

g2

Bar chart with “group by”

3. Time Series Plot of Water Depth by Location and Day

Then select the date question to use as the x-axis. This settings field is just under the name of the survey. Also select a period for the time axis. In this example I selected “day”.  The settings panel will then look something like this:

s1

Settings Dialog Configured for Time Series

The resultant graph shows average water height per day and per location. Note the gap in data between the 14th of January and the 5th of February.  No measurements were taken during this period.

g3

Time series chart by location by day

 4. Time Series Plot of Water Depth by Location and Week

If you then open the settings and change the period to “week” the x-axis of the graph will be updated so that average water height per week and per location is shown.

g4

Time series chart by location by week


Smap Server version 13.12 with Time Series Analysis

Announcing the release of Smap Evaluation Tools Server version 13.12. The time series analysis functionality in this release has been funded by the Speed Evidence project. This is to assist in the long term response to Typhoon Haiyan.

New functionality

  1. Time Series Analysis.  Showing trends over time using graphs, maps and tables in the analysis module.
  2. Server side calculations.  There are only two functions available at the moment; area of a polygon and length of a line or the perimeter of a polygon.  However other functions could be added such as the calculation of Z-score anthropometric indicators.
  3. Export of attributes from parent forms to shape files.  If you select a child form containing a geometry and export to a shape file then all the attributes of the parent (up to the maximum of 255) will also be exported.
  4. Specification of default language.  The default language to show on the phone can now be specified by selecting “view/edit” link next to the survey name on the template management page.
  5. Support for Internet Explorer has been improved however it is still not supported, that is I haven’t tested this release against IE.

Availability

Hosted servers will be progressively updated over the next week or so.  The download for this release will be available by the 19th of January.