Category Archives: Uncategorized

Announcement of Smap Release August 2013

This release includes:

  1. The name of the logged on user will now be shown in the top right of the template management screen. If you click on this name you can change your details and your password.  You can also logout of the server.
  2. A change in the appearance of the “upload template” section of template management.  The big button now downloads the spreadsheet instead of opening odkBuild.  The link to odkBuild has been moved further down the screen.
  3. Performance improvements when multiple users are updating the dashboard using the same user name.
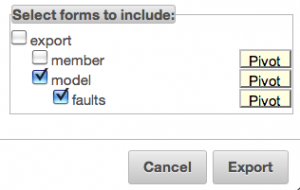
  4. When exporting surveys to a spreadsheet, you can now select which repeating groups to export and flatten individual repeating groups so that their data appears in a single row.  More on this here.  You can also specify that the GPS coordinates of a point be split into two columns for latitude and longitude.  This may assist when importing the survey into some GIS tools.

vehicle_faults

Map with locations shown by OCHA icons

This is another test of embedding a Smap report into WordPress. Here is the report now.

https://dev.smap.com.au/surveyKPI/reports/view/55b17e69-e303-4993-94af-679ac21187e7

The major change since the last test report is more space for the meta information and the creation of automatic commentary on the report.  For example the lines:

  1. Shows the location of responses to the question ‘Select type’ in survey ‘ocha’ grouped by the responses to the question Record location
  2. Shows the percentage of responses that selected each option in the question ‘Problems’ in survey ‘speed’ grouped by the responses to the question Set Location

These were automatically generated to describe the two layers of data on the map.  I think they could be clearer though.  The final line “Comment provided by DME manager” was typed in when the report was created in Smap and before it was published to WordPress.

Embedding into WordPress is a great way to publish reports as you can add supporting material.  For example here is a tweet.

Anyway for more information contact me at Smap Consulting.  neilpenman@gmail.com


Smap Reports API version 1.0 Released

The API can be used to retrieve report data from a Smap server.  This version is out of draft however it will evolve with feedback from the Speed Evidence project team and the Ushahidi developers who are creating a Portal that will consume the API.  Hopefully it should be fully implemented in Smap releases from the 1st of August.

Download from here.

The API will allow the proposed Speed Evidence Portal to present survey data alongside relevant community information submitted using SMS messages.

Statistical Analysis of Public Tweets to Provide Early Notification of Emergency Events

CSIRO have been developing software for monitoring social media.  Last monday I went to Canberra to talk to Ron Jones who is responsible for business development of these products.  We met, near his office on the ANU campus, at the Purple Pickle cafe.

We discussed two products but I am going to focus on the Emergency Situation Awareness application (ESA) for this blog post since its very relevant to the work that Smap Consulting does. The title of this post is a quote from a video produced by CSIRO showing how ESA works.

My understanding is that ESA analyses the frequency of occurrence of key words or hashtags in tweets over a period of several months. Then if there is a deviation from the background level of a word during a 2 minute window an alert will be created at one of 4 levels depending on the amount of deviation; green-blue-purple-red.  Here is a screen shot from the video showing alerts for the word storm around about the time a tropical storm hit Brisbane.

alerts


The second column is the date and time that the alerts began, the third column the duration that an elevated alert level was maintained and the 4th column the number of alerts during that period. ESA has an API that allows an external system to interrogate the statistical server.

This would be a great tool to integrate with Smap and Ushahidi to get a better picture of the situation after a rapid onset emergency.  ESA could be used to identify new events while Smap can be used to provide an assessment of that event.  The results can then be shown on a tool such as the Speed portal, further filtering the “firehose” of information that emergency workers can be subjected to.

Getting this tool applied to rapid onset emergencies in developing countries would require a little bit of effort and cash. For example currently only tweets in Australia are monitored.  Possibly we would need a server for Africa or Asia etc. However it looks very promising to me.


Smap API

I have been working on a project to allow reports from Smap to be added to a portal that provides an assessment of the situation in the first 72 hours after a rapid onset emergency. This is for World Vision’s Speed Evidence project, Ushahidi are writing the portal.

These new reports support oembed so they can be inserted into a wordpress blog such as this one. Here is a report containing a map.

https://dev.smap.com.au/surveyKPI/reports/view/55b17e69-e303-4993-94af-679ac21187e7

The above report is a map from the Smap analysis dashboard showing:

  1. A select multiple question on problems grouped by an arbitrary set of hexagonal polygons.  The colours represent the relative percentages of interviewees who reported safety concerns in the hexagonal area.  Red indicates a very high percentage blue a very low percentage. Green is somewhere in the middle. (It follows the Red – Orange – Yellow – Green – Blue scale).
  2. A select one question on type of refugee camps in the area

Here is another report containing a graph showing the problems reported grouped by the gender of the person reporting the problem.

https://dev.smap.com.au/surveyKPI/reports/view/b4a5a777-da5b-4227-ba36-bcb2dec14c5a

Finally here is a report containing a table.

https://dev.smap.com.au/surveyKPI/reports/view/d6b4f980-ca9e-4ac3-8728-01dcd1587962

This table shows the average age of the people who reported each problem.

This capability is still beta and will be released in 2-3 weeks.  Some of the work that still needs to happen includes:

  1. Setting the size of the report so it doesn’t leave whitespace when embedded in wordpress or another container
  2. Better legends and descriptions of the content of the report generated directly by the Smap server.