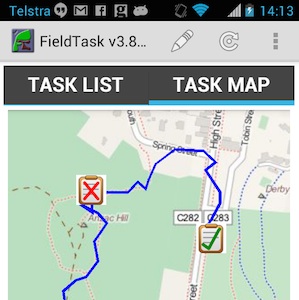
Author Archives: Neil Penman

Version 14.10 – Bug Fixes

This is a minor release with just some fairly minor bug fixes.  These include:

  • French translations have been added replacing the dummy words that I had previously used for testing.  Thank you to Baba Sy for providing these translations.
  • Show an error message if a template is uploaded when the user does not have access to any projects.  (Thank you to Janna Metzler for identifying this issue)
  • Prevent the editing of results that have been marked as “bad”.  For example if they have already been edited and replaced by another record.
  • Fixed several issues with roles.  It now works much better if a user is assigned a role of analyst but not administrator or vice versa.  A user with only enum rights can now also use webForms.
  • Replaced links to the old help pages with links to the google drive holding the documentation
  • Prevent a malformed template being created if you upload a completely empty template.  This now reports an error and does not create the template.  Previously it reported the error but still created a template that could not be run on fieldTask
  • Fix paging through results on the monitor page. Previously the page buttons were hidden.
  • Thumbnails were not being created for pictures with an extension of JPG (in capitals)
  • Support added for select multiple questions when exporting to Neo4J
  • Only allow a single select multiple question to be exported to a Neo4J node or relation
  • Prevent Neo4J labels from having spaces
  • Improve clarity of reporting errors in templates when using template upload.  Multiple redundant messages were previously created when calculate questions with lots of parameters had circular references.

The server can be downloaded from http://www.smap.com.au/downloads.shtml.


Version 14.09 – Form Refresh and Export to Neo4j

Version 14.09 of Smap is available for download.

Refresh – Synchronising phones with the server

The refresh button on fieldTask now does more than just clear the submitted results from the screen. It also now refreshes the forms that you have on your phone and submits any finalised results.  Note you will need to download fieldTask version 2.3.5 from your server on to your phone to use this new feature.

Pressing refresh will now:

        • Download new forms from the server that have been assigned to the user of the phone
        • Show available forms with a yellow clipboard icon
        • Update forms on the phone that have a new version
        • Delete forms from the phone for which the user no longer has access
        • Submit finalised results from the phone to the server
        • Notify the server of the list of forms and their version that the user has downloaded to their phone

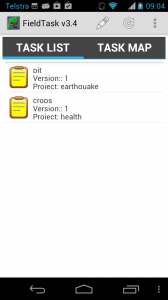
You can select a form from the task list screen to complete a survey.  The name, version and project containing the form are shown next to the icon.

device-2014-09-20-090412

Phone with two forms

This new feature should simplify the training of the data collectors as the steps they need to download new forms, start a survey and submit results are all simpler.

Checking that data collectors have the correct version of a form

Sometimes it can happen that data collectors go out into the field with the wrong version of a form on  their phone.  At worst this may have an impact on quality of the collected data and at best you will need to do some messy combining of the data from the two forms prior to analysis. This new feature makes it much easier to check that all the data collectors have the correct version of the form.

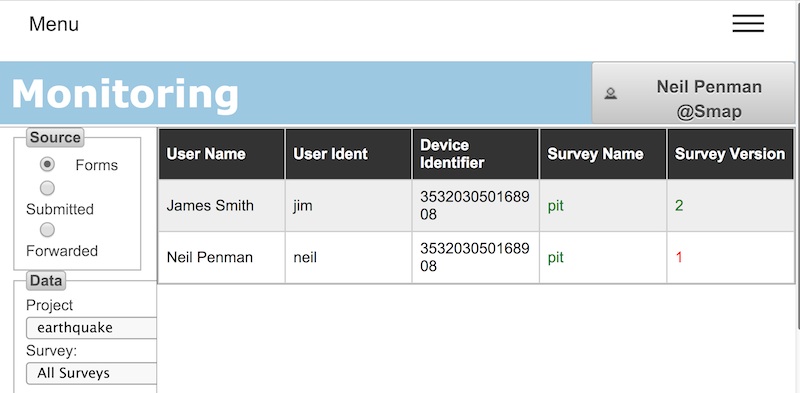
From the monitor page select forms.  This will show the users, phones, downloaded forms and the versions of those forms that have been downloaded.  Any users / phones that have not downloaded a form or have an older version are highlighted.

monitor

Monitor Downloaded Forms

 Exporting results to Neo4J / Thingsat

You can now export results to the Neo4J graph database. This change was developed in collaboration with thingsat.  The following video shows how this can be done.

Other Changes

  1. You can edit collected data using web forms.  This capability is enabled by an administrator for your organisation.  By default it is off.  If you select a table showing data for the whole of survey then there will be a button next to each data record that will open the survey results in a web form. If the data is updated the old results will be marked as bad, and then the updated results added.
  2. When you attempt to submit results from a phone for a survey that has been deleted on the server then the error message will be “Not Found” rather than “Not Authorised”
  3. The error message shown, if you upload a survey template that has duplicate options, has been made clearer

Moving a form to a different project (New in 14.08)

This is a new feature in version 14.08.  You may find that you have too many forms in a single project which is confusing to the data collectors as they may not be sure which form they need to download and complete.

You can create additional projects in the user management screen and then move some of the forms into one of the new projects.

1. First click on the form name in the template management screen.  This will take you into the form editor.

settings

Settings page of form editor

2. Select the project that you want to move to

3. Click on the “Save Settings” button

This will change your default project to the new project so if you want to move another form you will need to select the old project again then repeat the process


Update to 14.08 – Stata Export and Translation Editor

Summary of changes

  • You can edit question and option text directly in the server.  This includes the ability to edit translations. This change is the first stage of creating a complete editor for Smap.  To access it click on the form name in the template management page.  Then select the “view” and then “translations” menu option to start editing. When you save changes the version of the form will be updated.  This version will be returned with the data in each submission and is included in the export of results.  You can see what changes were applied to each version by selecting “view” and then “changes” on the edit page. This feature should be considered a “beta”.  If you want to record the version of the template with each data submission you will need to get version 3.4 of fieldTask from the server.
  • Reporting of errors in surveys defined by xlsform have been made clearer.  More information is now provided to assist in getting help in fixing the errors.
  • Support for presenting the server in multiple languages has been added.  Much more needs to be done to complete translations but the basic capability is there.  If you are interested in contributing to a translation then contact neilpenman@gmail.com.
  • Exporting of surveys to Stata.  This export creates a zip file with a csv containing the data and a “do” file which can be used to add labels to the data in stata.  This video shows how it works: https://www.youtube.com/watch?v=wnhR9JPw6NY
  • Read only questions are no longer included in exports as a default.  There is a chenckbox you can select to include them.
  • FieldTask has been upgraded to use ODK1.4.3
  • External csv files can now be added to a survey. These can contain data from previous surveys or lists of options.
  • You can no longer forward a survey to itself. That prevents the survey forwarding going into an infinite loop.
  • Forms can be moved to a different project


Update to Version 14.05

I’ve updated the downloads page to point to version 14.05.02 of Smap.  This contains a minor bug fix to address a problem where the individual coordinates of a polygon were not being shown in the whole of survey table view.  The overall polygon was shown.

More importantly I’ve added some instructions in the README file on changing Apache configuration files if you are doing an upgrade to your own server. There have been some changes to these files in the latest release and the deploy script does not apply these changes as system configuration files are only modified on install.

The files affected are:

  • /etc/apache2/sites-available/default
  • /etc/apache2/sites-available/default-ssl

You can update these by replacing them with the default and default-ssl files from smap/install/config.  However these files need to be updated to set the location of your attachments on the file system.  Everywhere in these files that you see {your_files} replace that with the correct file location, by default this should be /smap.

If you get an error message ‘Invalid command Header’ when starting Apache then you will need to type “sudo a2enmod headers”. That only needs to be done once then Apache will have the module that processes headers.

If you have any problems with this upgrade contact smap support.

Version 14.05

Announcing the release of version 14.05. If you are installing or upgrading you can download from http://www.smap.com.au/downloads.shtml.  I’ll be rolling this release out to other servers I manage over the next week.

New Features

Humanitarian Openstreetmap Layer (HOT)

You can make HOT the background map on a map view by selecting the expand button labelled as “<“. You will then see a list of the available map backgrounds including openstreetmaps, google maps, google satellite and now HOT.

download

HOT Map Background Layer

The data on the map is the same as standard Openstreetmap however it is styled to show features in a way that is more relevant to aid workers.

Webforms

These has been updated to use the latest version of Enketo core which includes new features for collecting lines and shapes.

You can also add an appearance of “likert” to a select_one question to get the options displayed on a Likert scale. likert

Although webforms are now fairly mature I would not recommend their use in large critical offline surveys just yet.  In recent testing there were issues with slow response to user actions on even quite small surveys and in some browsers on some devices there were crashes when accessing location.  However feel free to try then out and share your experiences.

Results Filter

You can specify a filter on results.  For example as well as say, requesting a graph of problems by region, you can also specify that only results from women are returned.  Currently this where filter only works on select_one, select_multiple and text questions. However it will be extended to other types of questions in a future release.

settings

Settings Popup

If you click on the “Filter By Value” button on the settings popup, then you will be able to select the question to filter by.  Unfortunately at the moment you can select any question even though only the select_one, select_multiple questions and text will work.

Once you have set a filter on an analysis panel / view then the “filter By” Value” button will be green and the filtering will be included in the results description.  To remove the filter select the “Filter By Value” button and press “clear”.

filter

Filter popup

Miscelaneous Changes to Analysis

  • Paging of results. The forward and back buttons no longer scroll with the results so you don’t need to scroll all the way back to the beginning in order to select these buttons.
  • Total function. Previously if you had a numeric question and you wanted to see results grouped against another question such as region, then you could only get the “average” value per region.  Now you can get the “total”. For example the total area of all the farm plots by region.
  • Specifying units in server side calculations. You can now specify units in server side functions. An area function can return results in Hectares or meters squared.  A length function in kilometers or meters. These units are shown on graph labels. Because you can now select the units the number of places after the decimal point has been limited to 2.
  • “Bad” records are no longer shown in Map and Media views.  Previously if you looked at the whole of survey results then you would see the records that had been marked “bad” on the map.  If you want to review bad records the only way to do that is to create a table view for the whole of the survey, that is do not select a question.
  • The default title of an analysis panel is now set from the survey name if the user does not provide a title.
  • Analysis panels shown in expanded view are, nearly, full screen.  The only part of the web page that can still be seen, apart from the expanded panel, is the main menu across the top.
  • This button on the analysis page, has been replaced by 4 buttons each with a picture of the type of view / panel that is to be created; Graph, Map, Table and Media.

CSV Exports

CSV Exports have been replaced by a new function that is much faster.  Its faster both to export the data and to download it as the csv file is zipped before downloading. It is highly recommended that you use this instead of the XLS export when you have large numbers of results.  The main restrictions compared to exporting as XLS are

  • Some formatting is not performed
  • Only a single form can be selected and this form will be exported along with its parent and so on up to the top level form. So you can’t export data from more than 1 form at the same level in the hierarchy at the same time.
  • You can’t specify that a form will be exported as pivot or flat.  Effectively all the forms are exported as pivot and the number of records will be equal to the number of records in the selected form.

The above sounds more complex than it is.   If you try it then it should be obvious what is happening.

Exporting Surveys with Polygons and Lines

When exporting results of a polygon or line to excel the individual points are no longer included by default.  You can add them in if you like but this can make the exported spreadsheet large as in a pivot export an extra row is created per point.

Changes to Installation of the Server

  • Database upgraded to Postgresql 9.3
  • Support for Ubuntu 14.04 added
  • The need to set server IP address during install has been removed.  To install Smap on ubuntu you now just need to type ./install.sh into a terminal.  This change is in part to support installation on laptops where IP addresses change with each network that you connect to.


Areas and lines on webforms in version 14.05

Version 14.05 of Smap Server, due at the end of May, will support the drawing of areas and lines on top of maps.

shape

Completing a geoshape question in webforms

trace

Completing a geotrace question in webforms

Specifying the questions

You can add these questions in xlsform editor.

  1. For an area set the question type to “geoshape”.
  2. For lines set the question type to “geotrace”
  3. Set the appearance to “map” if you want to allow the data collector to select coordinates on a map as well as record location from their current position

Here is a sample form

One form per location question!

Don’t forget to put each geopoint, geoshape or geotrace question in a separate form.  The reason for this is that GIS systems assume that each table has a single location column and that all of the other columns are attributes of that location.  In Smap, 1 form becomes 1 table.  For example if you were recording the location of a water point and a household in one survey you would collect the household data in one form and then the water point data in another form.  The household form would contain the location of the household as well as the “attributes” of that location which is the other data about the household. The same goes for the water point.  In Smap you specify a different form by enclosing the questions in “Begin repeat” – “End Repeat” question types.

Use of geolinestring and geopolygon

Smap has had the ability to record areas and lines for some time using the geolinestring and geopolygon features.  These are still available and are useful in the following circumstances:

  1. You are using fieldTask which doesn’t yet support geoshape and geotrace
  2. You want to record data on each point.  For example you may want to record a temperature or a take a picture at each point of a line that you are recording.  Geolinestring and geopolygon allow you to add arbitrary questions to each point that is recorded.

Smap Assessment Cycle

The Smap website has been updated to show what I am calling the “Smap Assessment Cycle”.

cycle

Smap Assessment Cycle

The 4 stages are:

  1. Collect.
    Collection of data using fieldTask, odkCollect or WebForms
  2. Assess.
    The analysis of data on the Smap Server where you can view graphs, maps and tables as well as perform data cleaning.
  3. Publish (Internally or Externally).
    The export of data to a spreadsheet, GIS system, report for use in decision making. Publishing could be to another IT system such as program management, asset management, patient record system etc.
  4. Act.
    Assign tasks to users. For Smap a task involves completion of a survey. However real world actions can be prompted by that survey. For example:
  • Read only question, “Replace water pump”
  • Image question, Take a picture of installed pump
  • Barcode question, record barcode of pump

Demonstration

These stages can be performed in any order. In this demonstration the published data has come from an external asset management system, and the cycle starts from the Publish stage.

There is also no “Act” stage in the demonstration, refer to this post for more information.  Note this demonstration is using features that will be included in the 30th May Release of Smap including updates to the latest version of Enketo core.

Publish

The data has been published as map tiles using TileMill from MapBox. Tiles are used by google maps and most other online maps as they highly scalable. With TileMill you can style your maps to produce beautiful clear representations of the data that you want to show.

As well as the map images you can attach data to the maps. Hence if you select an item such as a road, or medical clinic, information on that item can be shown.

map1

Collect

The data associated with each item can be used as a key to conduct a survey using Smap’s webforms. By including the data in the survey URL, if there is any existing survey results that match, then they will be downloaded and set as the initial survey values. If there are no matches then a blank form will be returned.

form

Webform

Analyse

The data can be analysed using the standard Smap views of Maps, Graphs, Tables and Media.

analysis

Analysis

History of Changes

If you have updated existing data then that data is replaced and the graphs will only show the latest view. However a complete history of changes is kept and this can be seen by opening a table view and not specifying a specific question.

history

History of changes

Solomon Star News Report on use of Smap

The Solomon Star News had an article (21st April 2014) on the use of technology to assist in the response to the recent floods.   The technology is, of course, Smap which is being used by World Vision who are also making it available to Save the Children and SWIM (Short Workshops in Mission).

Morning Start Article

Technology Assists World Vision to reach flood affected families faster

Version 14.04 Bug Fixes

Just a small release this month due to the lateness of the March release.  The following bug fixes are included:

  • There is an option to group totals of uploads in the monitor page by device, week or day.  This should have been disabled unless a single survey has been selected.  If the total uploads for the whole project are being shown then its not possible to group these totals.
  • Addition of media such as photos to questions is now prevented if the question is not actually answerable by the user.  For example the survey start question and the device question are not shown to the user on the phone hence it is pointless adding a photo, video or audio to the question.
  • A security issue that allowed a user from one organisation to view data uploaded by another organisation has been fixed.
  • Upload of a template would fail if there were blank labels in some of the options in all of the languages.  This occured during a survey in Uganda when a partially completd survey was loaded for testing while the translations were being prepared.
  • If the user is not authorised to submit a survey now they will get an error message and can resubmit the results when they are authorised to do so. Currently the surveys are loaded onto the server successfully but then an error is reported on the monitoring page and the results are not applied to the database.  This can mean that the uploads are missed.