Monthly Archives: January 2014

Smap Version 14.01 Task Management

Announcing the release of Smap Evaluation Tools Server version 14.01.  This release includes

  • Task management: the ability to filter the surveys that are used as locations for new tasks
  • Task management: Printing of task allocations across multiple pages
  • Support for Internet Explorer 10+ as the browser
  • Improved reporting of errors when uploading templates

Task Management

Task Filtering

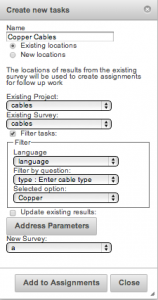
When you create new tasks from an existing survey you can now specify a filter on one of the questions in the existing survey.  Only survey locations that match that filter will be added to the new task group. Select the checkbox called “Filter tasks” to enable filtering.

tm1

Task Filtering


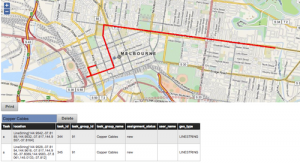
In the following example the previous survey recorded the paths of various cable types including copper and fibre.  However for the new task I only wanted the surveyor to go to the cables of type copper so I enabled filtering and selected the option of “copper”

tm2

Tasks filtered by cable type of copper

Printing Task Sheets

When you select the “Print” button to print a task sheet the tasks are now shown on more than one page.  This attached PDF shows this. Note the address parameters that have been added to help locate the location of each task.  In this case these include the age, ethnicity and a picture.


Setting the default language

One of the new features in version 13.12 of the Smap Server is the ability to set the default language.  Previously this was always the last language entered in the survey work sheet.

There are two ways of setting the default.

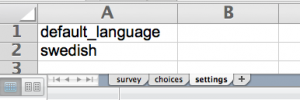
1. The xlsform standard way is to add a new worksheet “settings”.  Provide a single column with a heading of “default_language” enter the default language under that column.

lang1

Default Language in Xlsform

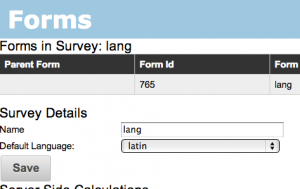
2. The other approach is to specify the default language directly in the smap server.  You can change the default here any time without having to reload the template.  You do this from the template management screen. Select “view/edit” next to the name of the survey you want to change.

lang2

Default language on Smap Server

Then select the default language from the drop down list.


Smap Version 13.12 available for download (and new download Site)

You can now find a list of Smap Server versions available for download at http://www.smap.com.au/downloads.shtml. Version13.12 as well as training documents are now available from that location.

Older versions of the server can still be downloaded from the Google code site.  https://code.google.com/p/smap-suite/downloads/list. Search for “Deprecated Downloads”.

The download is actually hosted on Amazon S3.  This move was required because Google no longer allow new downloadable files to be added to https://code.google.com.  Hence the training documents have all been moved to google drive and the large server files to Amazon S3.

Creating Time Series Graphs

With the release of version 13.12 of Smap Server you can create graphs, maps and tables that show data against a time axis. This post describes a series of steps that proceed from a very simple bar chart to a, still simple, time series graph.  You can of course create these time series graphs in one step however you might use this approach of progressively refining your settings in order to show progressively increasing details.

The data in the examples is artificial and is from a survey that collects water depth in a well from two different  locations.  The water depth question was of type “integer”, the location question was of type “select_one”.

1. Bar chart of water depth

First select “Add Panel” to create a new panel, select your survey, and your question then press the “save” button. You will see something like the following. This shows the average water height for all locations at all times.

g1

Bar Chart

2. Bar chart of Water Depth by Location

Then specify the location as the “group by” question. This will show the average water height at each location for the entire time of the survey.

g2

Bar chart with “group by”

3. Time Series Plot of Water Depth by Location and Day

Then select the date question to use as the x-axis. This settings field is just under the name of the survey. Also select a period for the time axis. In this example I selected “day”.  The settings panel will then look something like this:

s1

Settings Dialog Configured for Time Series

The resultant graph shows average water height per day and per location. Note the gap in data between the 14th of January and the 5th of February.  No measurements were taken during this period.

g3

Time series chart by location by day

 4. Time Series Plot of Water Depth by Location and Week

If you then open the settings and change the period to “week” the x-axis of the graph will be updated so that average water height per week and per location is shown.

g4

Time series chart by location by week


Smap Server version 13.12 with Time Series Analysis

Announcing the release of Smap Evaluation Tools Server version 13.12. The time series analysis functionality in this release has been funded by the Speed Evidence project. This is to assist in the long term response to Typhoon Haiyan.

New functionality

  1. Time Series Analysis.  Showing trends over time using graphs, maps and tables in the analysis module.
  2. Server side calculations.  There are only two functions available at the moment; area of a polygon and length of a line or the perimeter of a polygon.  However other functions could be added such as the calculation of Z-score anthropometric indicators.
  3. Export of attributes from parent forms to shape files.  If you select a child form containing a geometry and export to a shape file then all the attributes of the parent (up to the maximum of 255) will also be exported.
  4. Specification of default language.  The default language to show on the phone can now be specified by selecting “view/edit” link next to the survey name on the template management page.
  5. Support for Internet Explorer has been improved however it is still not supported, that is I haven’t tested this release against IE.

Availability

Hosted servers will be progressively updated over the next week or so.  The download for this release will be available by the 19th of January.


Time Zones in Reports and Graphs

Its timely to look at the use of time zones in reports and graphs since we will shortly be releasing a version of Smap that includes trend analysis.  This will allow you to create graphs and maps  showing trends in data against time.

The most common date columns in Smap reports are the start and end of the survey.  When these are shown in a table on the Smap server the time zone is included. For example the following is from a survey that started at 7:10pm in a time zone GMT + 11.

  • 2012-03-13 19:10:27.412+11

Note the time zone is shown as +11. When the survey is exported to Excel the time zone information is removed and the time is shown as GMT.

  • 13/03/2012  8:10:27 AM

This is because Excel can’t include the time zone in a date cell.  (At least I don’t think it can). However you can modify the time back to local time.  Dates in Excel are stored as floating point numbers.  If you add “1” to this date it will increment by 1 day.  So to change the time to a time zone of GMT + 11 you can add 11/24.

In a future release of Smap I will add an extra column for the time zone of the survey so that this information is available in the report.

Now getting back to the trend analysis. The times in the x-axis of trend graphs will be shown in the local time of the survey without timezone information.  So for the example above where the time interval is set to show results by the hour.  That survey result will fall within the x-axis period of:

  • 2012-03-13 19

In summary all dates and times in reports are in local time except when exported to Excel when they are shown as GMT.