Monthly Archives: May 2014

Areas and lines on webforms in version 14.05

Version 14.05 of Smap Server, due at the end of May, will support the drawing of areas and lines on top of maps.

shape

Completing a geoshape question in webforms

trace

Completing a geotrace question in webforms

Specifying the questions

You can add these questions in xlsform editor.

  1. For an area set the question type to “geoshape”.
  2. For lines set the question type to “geotrace”
  3. Set the appearance to “map” if you want to allow the data collector to select coordinates on a map as well as record location from their current position

Here is a sample form

One form per location question!

Don’t forget to put each geopoint, geoshape or geotrace question in a separate form.  The reason for this is that GIS systems assume that each table has a single location column and that all of the other columns are attributes of that location.  In Smap, 1 form becomes 1 table.  For example if you were recording the location of a water point and a household in one survey you would collect the household data in one form and then the water point data in another form.  The household form would contain the location of the household as well as the “attributes” of that location which is the other data about the household. The same goes for the water point.  In Smap you specify a different form by enclosing the questions in “Begin repeat” – “End Repeat” question types.

Use of geolinestring and geopolygon

Smap has had the ability to record areas and lines for some time using the geolinestring and geopolygon features.  These are still available and are useful in the following circumstances:

  1. You are using fieldTask which doesn’t yet support geoshape and geotrace
  2. You want to record data on each point.  For example you may want to record a temperature or a take a picture at each point of a line that you are recording.  Geolinestring and geopolygon allow you to add arbitrary questions to each point that is recorded.

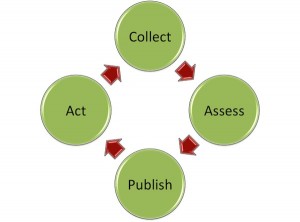
Smap Assessment Cycle

The Smap website has been updated to show what I am calling the “Smap Assessment Cycle”.

cycle

Smap Assessment Cycle

The 4 stages are:

  1. Collect.
    Collection of data using fieldTask, odkCollect or WebForms
  2. Assess.
    The analysis of data on the Smap Server where you can view graphs, maps and tables as well as perform data cleaning.
  3. Publish (Internally or Externally).
    The export of data to a spreadsheet, GIS system, report for use in decision making. Publishing could be to another IT system such as program management, asset management, patient record system etc.
  4. Act.
    Assign tasks to users. For Smap a task involves completion of a survey. However real world actions can be prompted by that survey. For example:
  • Read only question, “Replace water pump”
  • Image question, Take a picture of installed pump
  • Barcode question, record barcode of pump

Demonstration

These stages can be performed in any order. In this demonstration the published data has come from an external asset management system, and the cycle starts from the Publish stage.

There is also no “Act” stage in the demonstration, refer to this post for more information.  Note this demonstration is using features that will be included in the 30th May Release of Smap including updates to the latest version of Enketo core.

Publish

The data has been published as map tiles using TileMill from MapBox. Tiles are used by google maps and most other online maps as they highly scalable. With TileMill you can style your maps to produce beautiful clear representations of the data that you want to show.

As well as the map images you can attach data to the maps. Hence if you select an item such as a road, or medical clinic, information on that item can be shown.

map1

Collect

The data associated with each item can be used as a key to conduct a survey using Smap’s webforms. By including the data in the survey URL, if there is any existing survey results that match, then they will be downloaded and set as the initial survey values. If there are no matches then a blank form will be returned.

form

Webform

Analyse

The data can be analysed using the standard Smap views of Maps, Graphs, Tables and Media.

analysis

Analysis

History of Changes

If you have updated existing data then that data is replaced and the graphs will only show the latest view. However a complete history of changes is kept and this can be seen by opening a table view and not specifying a specific question.

history

History of changes

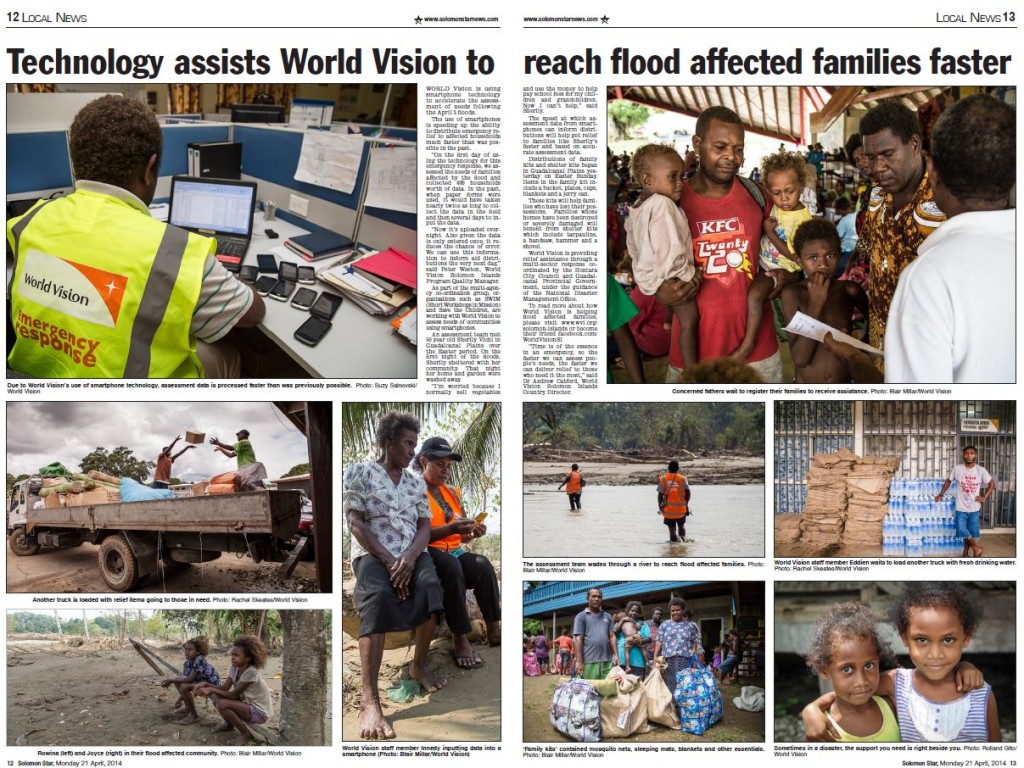
Solomon Star News Report on use of Smap

The Solomon Star News had an article (21st April 2014) on the use of technology to assist in the response to the recent floods.   The technology is, of course, Smap which is being used by World Vision who are also making it available to Save the Children and SWIM (Short Workshops in Mission).

Morning Start Article

Technology Assists World Vision to reach flood affected families faster

Version 14.04 Bug Fixes

Just a small release this month due to the lateness of the March release.  The following bug fixes are included:

  • There is an option to group totals of uploads in the monitor page by device, week or day.  This should have been disabled unless a single survey has been selected.  If the total uploads for the whole project are being shown then its not possible to group these totals.
  • Addition of media such as photos to questions is now prevented if the question is not actually answerable by the user.  For example the survey start question and the device question are not shown to the user on the phone hence it is pointless adding a photo, video or audio to the question.
  • A security issue that allowed a user from one organisation to view data uploaded by another organisation has been fixed.
  • Upload of a template would fail if there were blank labels in some of the options in all of the languages.  This occured during a survey in Uganda when a partially completd survey was loaded for testing while the translations were being prepared.
  • If the user is not authorised to submit a survey now they will get an error message and can resubmit the results when they are authorised to do so. Currently the surveys are loaded onto the server successfully but then an error is reported on the monitoring page and the results are not applied to the database.  This can mean that the uploads are missed.