There are many more features in version 17.12 than are documented here. Other release notes will follow.
Charts in FieldTask
Yes! you can show charts inside the form on your tablet or phone. You will need fieldTask version 5.23 as well as Smap Server 17.12 in order to use these. This work was sponsored by InformEd International.
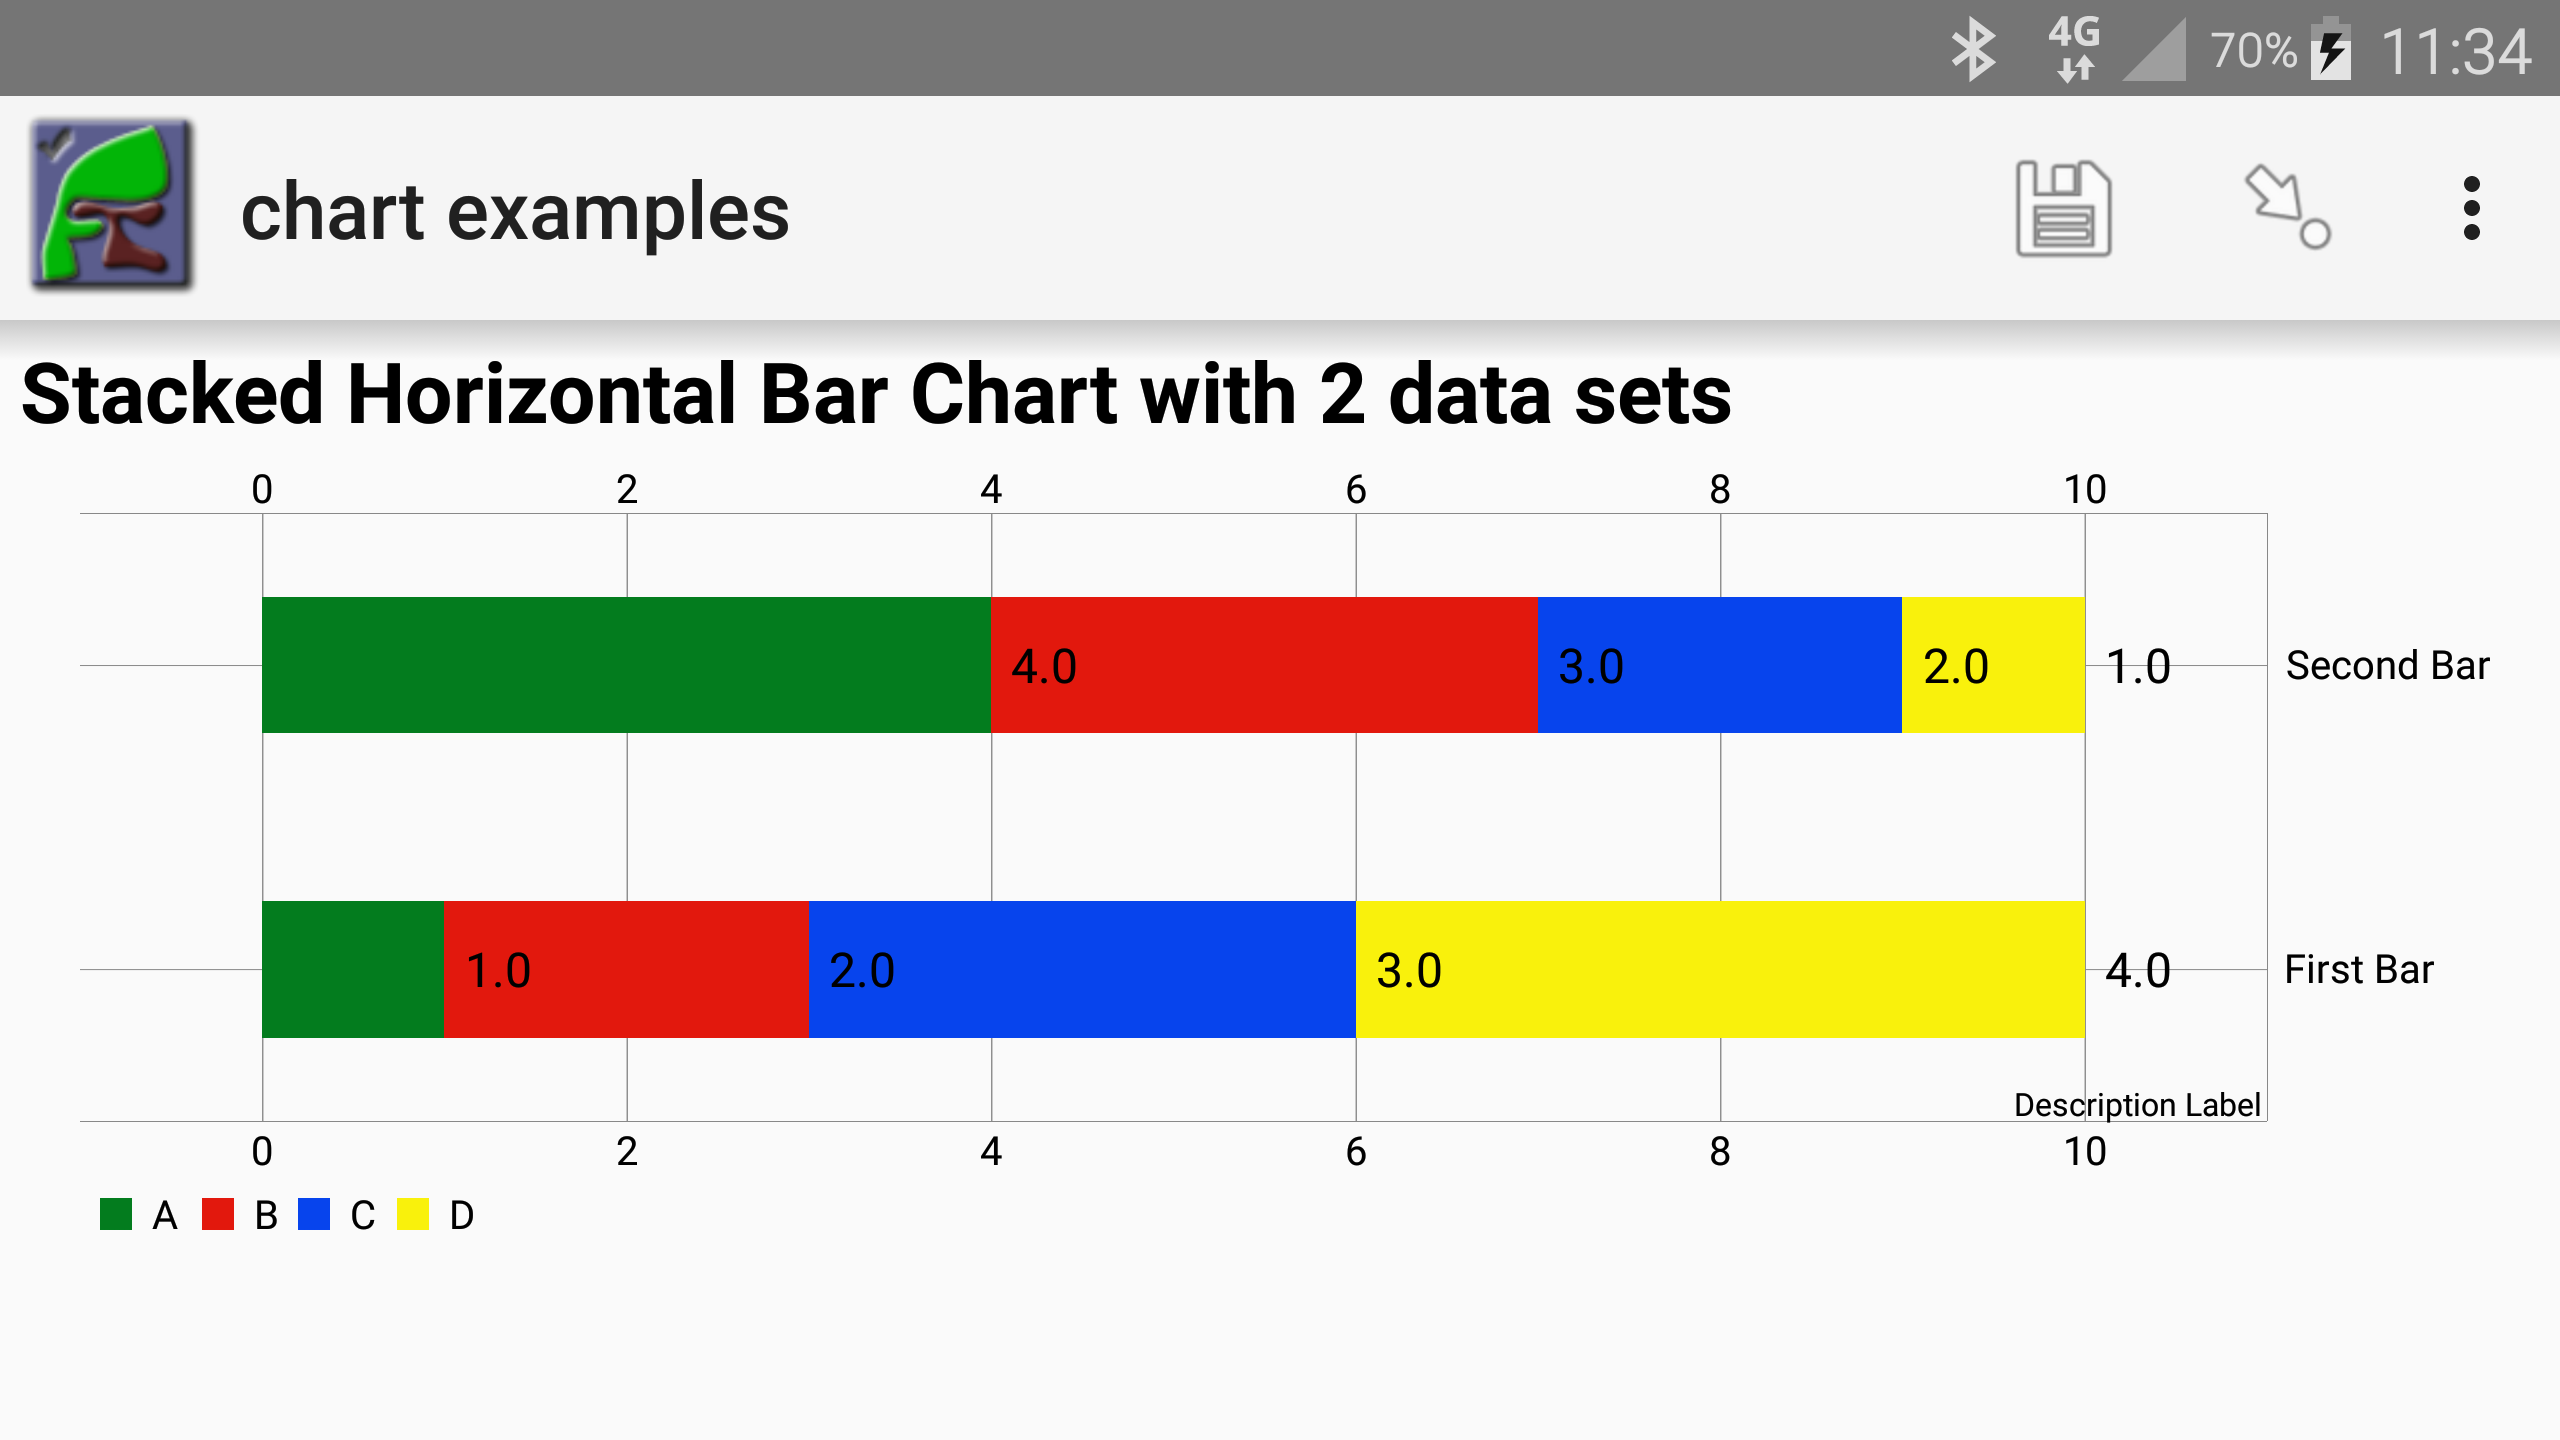
Here is an example form with basic charts. If you load the form in the link then you should see the following charts among others:

Showing time series data from other forms
Using the pulldata() function you can get data from previously submitted forms. We have now added a new pulldata() type that will retrieve data as a time series. Hence if you are collecting data over time and you want to see a chart of that time series you would use this new function.
pulldata(‘chart_xxxxx’, ‘data_column’, ‘key column’, key value)
The ‘chart_’ in the file name field tells the server to return data as a time series suitable for charting.
A detailed example form with comments can be found here.
Bugs Fixed
- Issue #156. Security roles page for a survey not being displayed
- Issue #157. Crash on export with language other than english
- Issue #158. Guidance not being added for tasks
- Issue #159. SMS URL deactivated
- Issue #160. Added a warning message on upload when a form references missing columns in a csv file