
New Features
Create histograms of text values including in calculate questions
When creating a histogram graph in the Analysis module you can select a text, calculate or server calculate question to display the frequency analysis. These can also not be used as “group” questions.
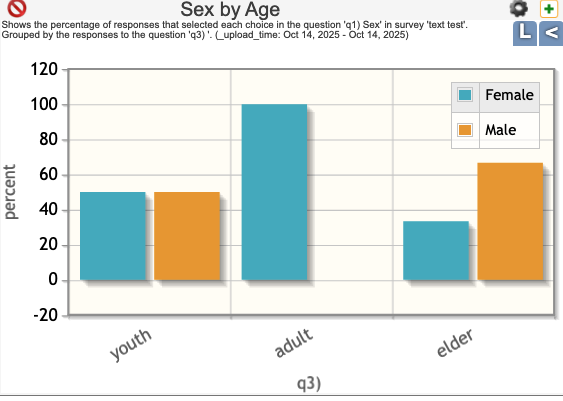
In the example above the age category is calculed from an integer age using:
if(${age} < 18, 'youth', if(${age} < 60, 'adult', 'elder'))In the analysis module I then created a graph that showed the sex grouped by the calculated age category.
Added a bundle access report
This is an administration report that can be found on the survey management page under the menu “Local Reports”. It will show survey name, project name, survey type and which users can access the survey for each survey in a bundle.

Other
- Support has been added for the “no-collapse” appearance in the online editor. This appearance can be used to prevent groups from being collapsed to hide questions in WebForms.
Dear Admin,
I have problem with exporting the data from Analyze so would you please to check that.
Thanks for your kind cooperation.
Sorry for the slow response I don’t comments closely enough. If you are still having a problem can you send send a fuller description to the email address smap-suite@googlegroups.com. Please include the server that you are using for example if it is https://sg.smap.com.au or some other server as well as enough information for me to understand what the issue is.
I wan to fill feedback
Great. If you want to discuss further you can email myself at neilpenman@smap.com.au