Monthly Archives: January 2019

Version 19.01

New Features

User activity views have been added to the dashboard. If you open a table view or a map view then you can specify the subject as “User Activity”. Then select a user to show their activity.

The source of data, such as the form name that was used to collect it, or the file name that was imported is now shown in the table view on the dashboard.

Added display_name to choices. Display names have been available for questions for a while. These allow you to specify a name to replace the question name in reports but one that is not constrained by the limitations of the odk question name. For example you can include spaces. These are now available for choices. This is particularly useful for select_multiple questions as now you can replace default column headers such as “Question Name – choice_name” with something more meaningful such as “The selected choice 10 !!!!”.

Add the ability to restrict activity within an organisation. For example you can prevent the submitting of any new survey results, access to the data api or sending of notifications. If any change is made to these settings the organisation owner will be notified by email.

Added some initial customisation of the webform page appearance. For example you can now set background colours for some of the components.

Add a new data processing option to reports. Transformation of data from Long to Wide. hence if you have done a longitudinal survey you can get a report on things within that survey with one row per thing and all the time series data converted to additional columns.

Added some settings data into a settings workbook when creating an excel report. This now shows the timezone used in the report as well as the start and end time of any date filtering applied.

Bug Fixes

  • Replacing a select_one question with a select_multiple question after data collection had started caused further submissions to the form to fail. Now fixed.
  • Multiple bug fixes in webforms. Images in choices now work again as does the selection of drop down select questions.

Conversational Surveys with Upinion

I have been looking at Upinion which seems to be a very nice tool for “Conversational Surveys”. Upinion define these as ongoing surveys conducted in a chat messaging tool such as facebook messenger or their own app. As a company Upinion are focussed on international development with the aim to “Amplify people’s voices in a crisis situation” and could be an excellent complementary information channel to use with Smap for getting a more complete view on a situation.

Upinion

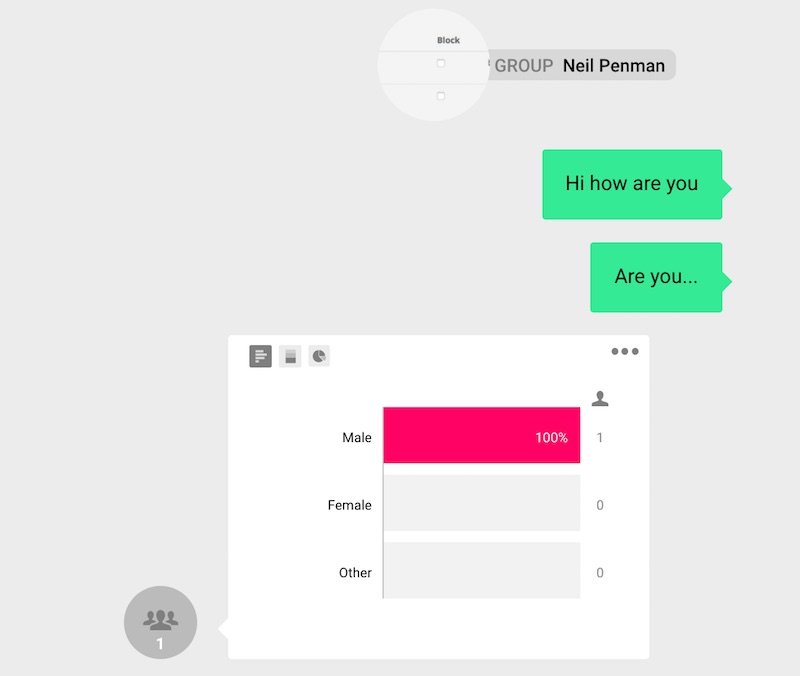
To specify the questions you are going to ask you create “conversations” using a GUI drag and drop editor. The screenshot below is from a test conversation I created. A graph of responses is shown automatically beneath each question as they are received.

Secondly you can attach a group to the conversation. This group will contain the respondents to your survey.

Finally you need to invite respondents to join a group. They might do this by scanning a barcode or clicking on a link. A key point is that the respondent needs to sign up in order to be involved in a discussion and they can revoke their membership and delete their personal data at any time.

Using Smap and Upinion together

There are a vast number of ways to collect data from the field, IOT devices, satellites / drones, surveys using enumerators, emailed or IVR surveys direct to respondents, conversational surveys as per Upinion etc.

The core Smap solution is the classic DME approach to conduct a survey with enumerators (we also support emailed surveys and webforms). This is probably the most rigorous and comprehensive way to get a snapshot of a situation at a point in time. However it does have a number of disadvantages. For example preparing the survey and collecting the data can take some time and has a reasonable cost. (Much quicker and cheaper than paper surveys though!). This cost and time tends to mean that you need to ask a lot of questions as you may not be back for a while and you are not sure what you need when the survey is being designed. Of course large numbers of questions can make responding to a survey time consuming for the respondents as well.

In order to get ongoing continuous data after the survey completes, the survey could identify people who have a smartphone and access to a network, and who would be prepared to act as a community contact or sentinel. They can be given a barcode to scan which will sign them up to an Upinion group. From that point on you can conduct conversations with these contacts to get a real time view of their situation and the situation in their community. Based on the information received you may then conducted another more targeted survey of the broader community using Smap.