New Features
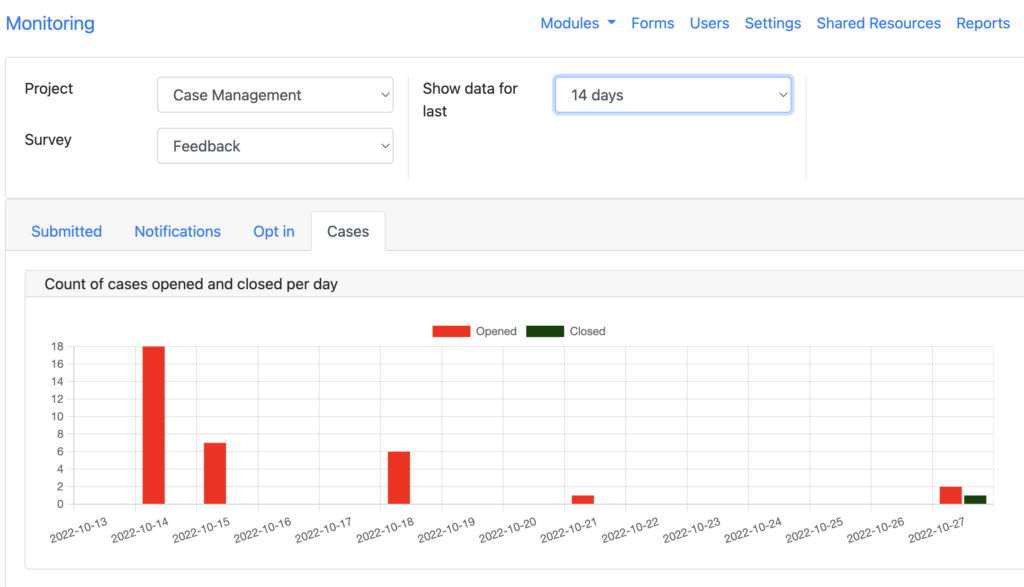
Case Monitoring tab
A tab has been added to the monitoring page to show the number of new cases created per day and the number closed. The period defaults to 7 days but can be extended to 30 days. Select a survey that has case management enabled to show data on the chart.

Documentation is available here.
Archiving of Survey data
Commonly people are creating surveys to manage their day to day operations. These can become large with millions of rows and because they are accessed frquently this can also cause performance issues. Another common feature of this sort of usage is that only the last 12 months, or an even shorter period, of data might be frequently accessed.
To support this use case we have added the ability to archive data older than a specified date into a new survey. This can be done from the analysis page using the aside. Refer to documentation here.

Data older than the specified date will be moved into a new survey, identical to the current one with the archive date enclosed in square brackets and appended to its name. The survey with the archive data will be blocked by default.
That may be where you want to stop or you could move this survey to a project dedicated to backups so that it is out of the way or you could just delete it if the old data is of no use.
Minimum Password Strength
It has previously been possible to set minimum password strengths for the server or an organisation however to do this you would have needed to have organisational administration privilege. There is now a new tab on the users page called “Other Settings” that allows an administrator to set the minimum password strength for their organisation.
Other Changes
- The appearance of the monitor page has been changed so that tabs are now used to separate different types of data.
- Add a control to select “placement-map” as an appearance in the online editor for geotrace, geoshape and geocompound type questions.
- Modify the chart view in the console to allow users to add charts. In the future it will be possible to add charts on question data however for the moment these charts still need to be related to case management.
- Performance improvments to the console
- Allow ampersands ‘&’ to be used in a choice value
- Allow the source of a static map included in a PDF to be specified as an appearance setting on a question. The source can be google or mapbox.
- When a survey is tested on the admin page that survey is now set as the default survey show that its results will show automatically in the console.
- Removed the ability to forward a submission to another server.
- Add a monthly report on events such as static map views.
