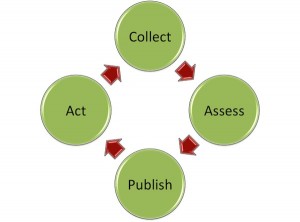
The Smap website has been updated to show what I am calling the “Smap Assessment Cycle”.
The 4 stages are:
- Collect.
Collection of data using fieldTask, odkCollect or WebForms - Assess.
The analysis of data on the Smap Server where you can view graphs, maps and tables as well as perform data cleaning. - Publish (Internally or Externally).
The export of data to a spreadsheet, GIS system, report for use in decision making. Publishing could be to another IT system such as program management, asset management, patient record system etc. - Act.
Assign tasks to users. For Smap a task involves completion of a survey. However real world actions can be prompted by that survey. For example:
- Read only question, “Replace water pump”
- Image question, Take a picture of installed pump
- Barcode question, record barcode of pump
Demonstration
These stages can be performed in any order. In this demonstration the published data has come from an external asset management system, and the cycle starts from the Publish stage.
There is also no “Act” stage in the demonstration, refer to this post for more information. Note this demonstration is using features that will be included in the 30th May Release of Smap including updates to the latest version of Enketo core.
Publish
The data has been published as map tiles using TileMill from MapBox. Tiles are used by google maps and most other online maps as they highly scalable. With TileMill you can style your maps to produce beautiful clear representations of the data that you want to show.
As well as the map images you can attach data to the maps. Hence if you select an item such as a road, or medical clinic, information on that item can be shown.
Collect
The data associated with each item can be used as a key to conduct a survey using Smap’s webforms. By including the data in the survey URL, if there is any existing survey results that match, then they will be downloaded and set as the initial survey values. If there are no matches then a blank form will be returned.
Analyse
The data can be analysed using the standard Smap views of Maps, Graphs, Tables and Media.
History of Changes
If you have updated existing data then that data is replaced and the graphs will only show the latest view. However a complete history of changes is kept and this can be seen by opening a table view and not specifying a specific question.


