New Features
Highlighting of survey types on the survey admin page

An additional column, labeled “Type”, shows the survey type. This is left blank if the survey is a standard data collection survey. A colour highlight is also applied to help make the survey type stand out.
| Survey Type | Highlight Colour | Description |
| Oversight | Orange | Survey used in the console to update a record |
| Read Only | Purple | Survey that is used by people with mobile devices to view data from the server, but does not submit any results. |
| Data | None | Standard data collection survey |
Assign a case from FieldTask
A case consists of a record of data and a survey form to update that record. Once a case is assigned to a user it will appear in FieldTask and in WebForms. The case can be updated multiple times until it is complete and no longer assigned.
In this release you can now assign a person to a case by selecting their name in a survey in FieldTask. For example in a policing app you may want to assign a particular detective to follow up a case from the field without requiring that to done as a back office function.

The survey that contains the assignee and the survey to be completed must either be the same or be in the same bundle. There must also be a key so that the record to be used in the case can be identified
Keys apply to bundles of surveys
Previously a unique key had to be specified for each individual survey. Multiple surveys combined into a single bundle could end up having different keys and key policies. This could cause problems as new entries from surveys without key policies would create duplicate records.
The obligation was on the survey designer to make sure each survey in the bundle had the same key, However now a common key is used across all bundles and only needs to be specified once.
When you select “Keys” in the File menu in the online editor, the case management page will be shown, you can then specify the common key for all the surveys in the bundle.
Other Changes
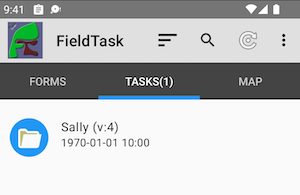
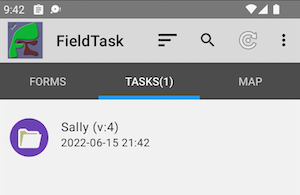
- Cases are now shown on the WebForms page on the tasks tab.
- Cases can be rejected in FieldTask and WebForms. The case will be set to not assigned. In WebForms the reject button is to the right of the button that opens the case. In FieldTask there is a menu option to the right of the case on the tasks tab. Select this then select the reject option. This feature requires FieldTask version 6.808.
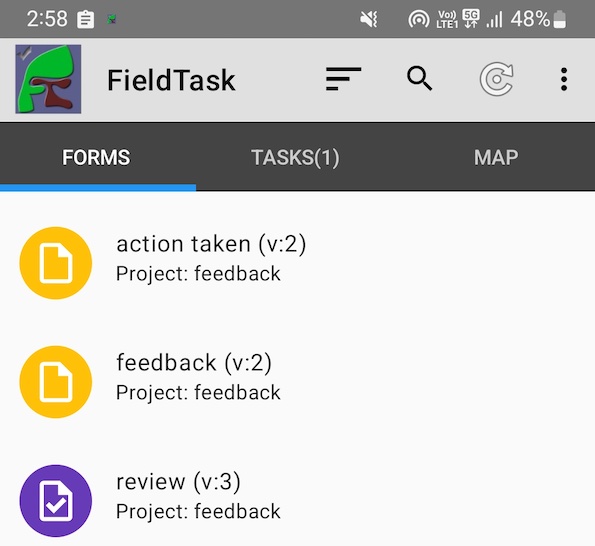
- WebForms will now mostly use the same colours as FieldTask to identify surveys and tasks. Yellow for data surveys, blue for tasks. The exception is for read only surveys which are coloured purple in fieldTask and grey in WebForms.
- WebForms now includes an icon in the task list that indicates whether the list item is a task or a case. Cases are identified using an open folder icon and tasks using a file icon.
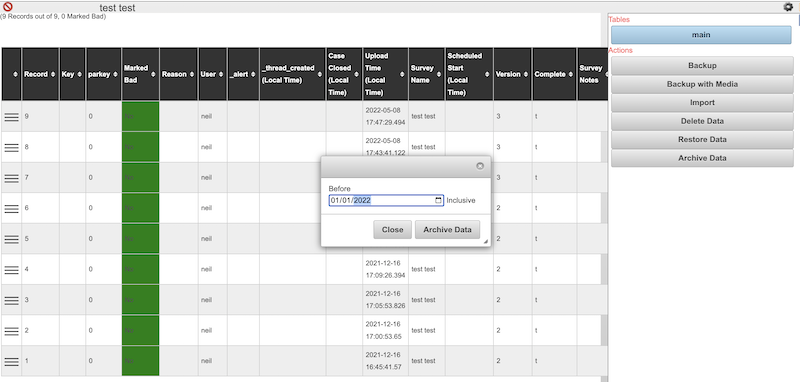
- The “view” button in the console is now always enabled. This allows a person to view details of an unassigned record, including its history, without having to lock it first.
- XLSForms can now include formula. Hence you could set choice names or labels using a formula and the value of that formula will be used in the survey.