This month we have revisited a design decision made 8 years ago to restrict each form to having a single geometry (geopoint, geoshape, geotrace). By form I mean the main form within a survey or a subform that can be created using “begin repeat”.
The rationale for this was that shape files used in GIS analysis, and GeoJSON files, only allow a single geometry. All the other values are attributes of that one geometry. So the geometry might specify the location of a building with attributes such as name, number of stories, construction material. In a similar way in Smap each Form and Sub Form is stored in its own database table and this table was allowed at most one geometry with all the other questions being attributes of that geometry. In addition the location was always renamed to “the_geom” which simplified some of the early coding in Smap.
This restriction has now been lifted. You can specify multiple geopoints, geoshapes and geotraces in a single form. The relationship between these geometries and the other questions in the form is up to you and your from design. You may decide that a single geometry per form still makes sense for your project in which case you can create your forms that way.
Multiple geometries in a form
Uploading Surveys from a spreadsheet
No longer will you get an error if you have more than one location in your form. Also location questions will no longer be automatically renamed to “the_geom”. This has the potential to cause problems if you are updating an existing survey that has already collected location data. The issue can happen if:
- You created a survey in a spreadsheet with a geopoint called say “my_location”
- You uploaded that survey to Smap version 20.09 or less where its name would have been changed to “the_geom”
- You then complete some surveys
- Later you decide to make some change to the survey and you replace the existing survey. In the meantime Smap has been updated to version 20.10.
- Now your location question will not be renamed and future surveys will record the location under “my_location”.
If the above happens you will see a warning in red text when you replace the survey saying that the location question will have a different name. If that is going to be an issue you can go back to your spreadsheet and change the name of the location question to “the_geom” so that it is compatible with the previously collected data. Then replace the survey again.
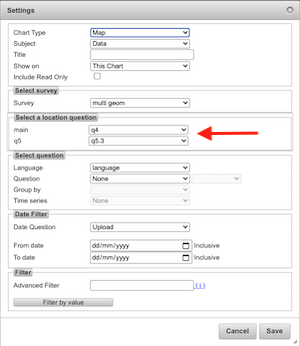
Analysis Page
When you create a map view for a survey you can now specify the geometry to be used for each form in the survey. A single geometry from each form will then be displayed on the map.
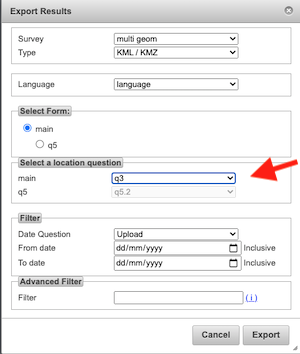
Exporting Shape, KML and VRT files
When exporting these files you first have to select the form / sub form your are exporting. Now you can also select the location question to use.
Data API
If you specify that the data is returned as geoJson you can now optionally specify the question that will be set as the geometry using “geom_question” in the URL, for example:
http://demo.smap.com.au/api/v1/data/s1_34?links=true&geom_question=q3&geo_json=yesImporting Data
Previously when you backed up collect data to a spreadsheet, a geopoint question would be put under two columns “lat” and “lon”. Now each geopoint will still be put in two columns but the name will include the question name so for example “my_location_lat” and “my_location_lon”.
If you have an existing backup with just lat_lon then you can still import that as the system will just grab the first geopoint question that it can find in the form and of course there should only be one in that case.
Start Location
If you set start location in your survey then the location of the start of the survey will be automatically recorded without requiring input from the enumerator.
You can now select this preload to show on a map in the analysis page, export a shapefile based on the location or create follow up tasks at the location.
Note. When creating tasks the location question to be used is found automatically, it is chosen in the following order:
- First. The first geopoint question answered by an enumerator that is found in the top level form
- Second. A geopoint value automatically set using the “Start Location” preload
- Third. The geometric center of the first geoshape or geotrace question that is found in the top level form
Other Changes
- Users with “View Data” permission can now access reports
- Fixed a bug where having server side calculations in a survey caused creation of a backup of the survey results in a spreadsheet to fail
- Add a warning message in webforms if a browser is not supported. Previously some older browsers could just cause webforms to stop