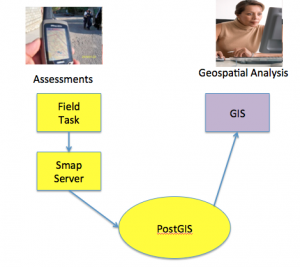
The smap server stores data in a postgis which is Postgresql with GIS extensions. This means that survey results can easily be analysed by a GIS system such as ESRI ArcGIS or qGIS.
GIS features available directly in Smap include:
- Showing results on a map.
- Aggregation of results by regions such as province, district (the region boundaries would need to have been added to the postgis database)
- Creation of ad-hoc grids to aggregate data. This is useful when suitable region boundaries are not available.
Collecting Points Areas and Lines
To associate a form with a point, add a “geopoint” question to your form.
To add an area to a form create a sub-form, give it a name that starts with “geopolygon_”. In the sub-form specify a geopoint question.
Take the same approach to add a line to form. This time start the name of the sub-form with “geolinestring_”.
All of these three location types are displayed in the GIS database as geometry types and can be shown on a map panel.
The map panel will create 2 layers for each line or area form. One layer contains the geometry, the other the points of the geometry. In the panel shown above the points layer for the area survey has been hidden.


